Suicide
This section presents information on deaths that occurred as a result Intentional self-harm. NMD records that included the following ICD-10 codes were included in this section:
- the UCoD was Intentional self-harm (X60–X84); or
- the MCoDs included codes for Intentional self-harm (X60–X84) and for Injury (S00–T75 or T79).
Few deaths were included by the second criterion. The title of ICD-10 code block X60–X84 is Intentional self-harm. Deaths coded to this range are commonly referred to as ‘suicide’, a practice followed here, although the scope of inclusion of the code block includes ’purposely self-inflicted poisoning or injury’, as well as suicide and attempted suicide. That is, it could include deaths due to Intentional self-harm where a fatal outcome was not intended.
SES by sex and age
In 2015–16, rates of Suicide deaths overall, and for males, declined with increasing socioeconomic advantage (Table 2.7). The rate for the most disadvantaged socioeconomic group (15 deaths per 100,000 population) was 1.7 times the rate for the least disadvantaged socioeconomic group (9 deaths per 100,000 population). Similarly, for males, the rate for the most disadvantaged socioeconomic group was 1.8 times the rate for the least disadvantaged socioeconomic group. A different pattern was observed for females, for whom rates remained relatively steady across socioeconomic groups, with only the rate for the highest (least disadvantaged) socioeconomic group being noticeably lower. Rates for males were generally around 3 to 4 times as high as rates for females across the 5 socioeconomic groups.
|
|
Socioeconomic status of area of usual residence | |||||
|---|---|---|---|---|---|---|
| 1 – lowest | 2 | 3 | 4 | 5 – highest | Total(a) | |
| Males | ||||||
| Deaths | 547 | 482 | 461 | 393 | 312 | 2,216 |
| Deaths per 100,000(b) | 23.3 | 20.0 | 19.2 | 16.3 | 13.1 | 18.5 |
| Rate ratio (c) | 1.3 | 1.1 | 1.0 | 0.9 | 0.7 | |
| Females | ||||||
| Deaths |
142 |
159 |
166 | 154 | 106 | 730 |
| Deaths per 100,000(b) | 6.1 | 6.6 | 6.8 | 6.3 | 4.2 | 6.0 |
| Rate ratio(c) | 1.0 | 1.1 | 1.1 | 1.1 | 0.7 | |
| Persons | ||||||
| Deaths |
689 |
641 |
627 | 547 | 418 | 2,946 |
| Deaths per 100,000(b) | 14.6 | 13.2 | 12.9 | 11.2 | 8.5 | 12.1 |
| Rate ratio(c) | 1.2 | 1.1 | 1.1 | 0.9 | 0.7 | |
Notes
- ‘Total’ includes cases for which the socioeconomic group was not able to be determined.
- Rates are directly age-standardised using populations by socioeconomic status groups, which do not include persons in areas for which the socioeconomic status could not be determined. Therefore, the total standardised rates for analyses by socioeconomic status group differ from rates calculated by state or territory.
- Rate ratio = rate for each individual socioeconomic group/total rate.
Figure 2.19 shows the proportion of Suicide deaths in each socioeconomic group for males and for females. As for rates (see Table 2.7), the proportion of deaths for males declined steadily with increasing socioeconomic advantage. A different pattern was observed for females, with the highest proportion of deaths occurring in the middle socioeconomic group.
Figure 2.19: Proportion of Suicide deaths, by socioeconomic group, by sex, Australia, 2015–16
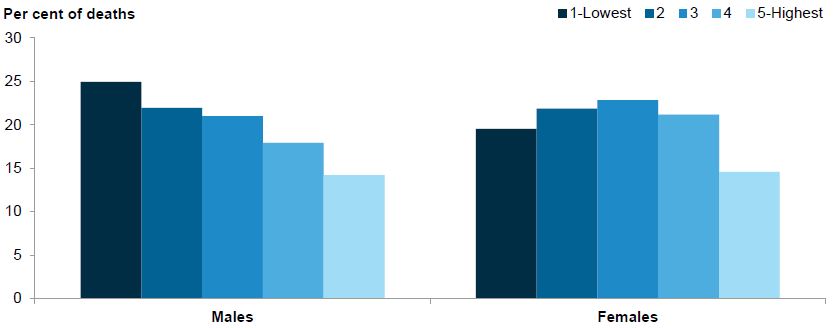
Note: Data underpinning this figure can be found in Table S19 in the supplementary tables spreadsheet.
Figure 2.20 shows the age-specific rates of Suicide deaths, by socioeconomic group. For those aged 25–44 and 45–64, rates declined with increasing socioeconomic advantage, with this effect most pronounced for the 25–44 age group. For those aged 15–24, rates tended to decline with increasing socioeconomic advantage—although this decline in rates was not steady across socioeconomic groups. In contrast, for those aged 65 and over, rates rose with increasing socioeconomic advantage, apart from the lowest (least disadvantaged) socioeconomic group, which recorded the lowest rate for this age group.
Figure 2.20: Age-specific rates of Suicide deaths, by age group, by socioeconomic group, Australia, 2015–16
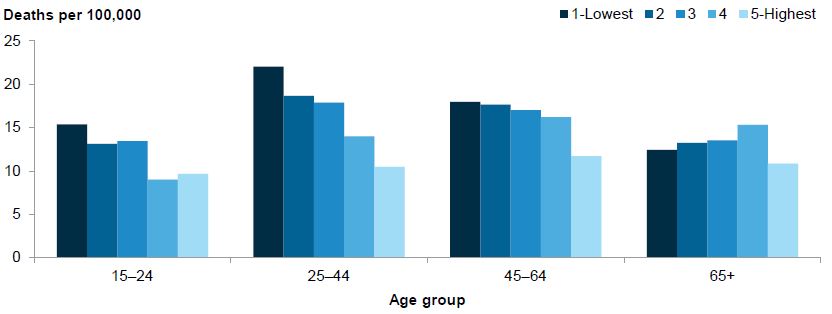
Notes
- Rates are directly age-standardised using populations by socioeconomic status groups, which do not include persons in areas for which the socioeconomic status could not be determined. Therefore, the total standardised rates for analyses by socioeconomic status group differ from rates calculated by state or territory.
- Data underpinning this figure can be found in Table S20 in the supplementary tables spreadsheet.
Figure 2.21 shows the proportion of Suicide deaths in each socioeconomic group, by age group. For all 4 of the oldest age groups, the proportion of deaths tended to decline with increasing socioeconomic advantage. The association between the proportion of deaths and SES was most pronounced in those aged 25–44 and least pronounced in the 2 oldest age groups which shared similar socioeconomic profiles. Results are not shown for children aged 0–14, due to low case numbers.
Figure 2.21: Proportion of Suicide deaths, by socioeconomic group, by age group, Australia, 2015–16
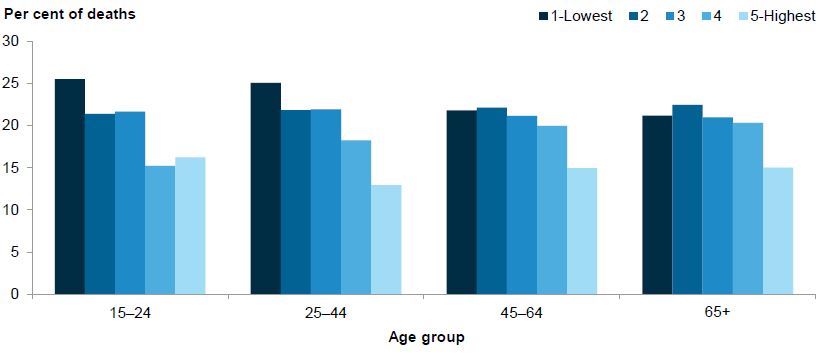
Note: Data underpinning this figure can be found in Table S21 in the supplementary tables spreadsheet.