Suicide & self-harm monitoring
The use of mental health services, psychological distress, loneliness, suicide, ambulance attendances and COVID-19
Background
While there has been a rise in the use of mental health and crisis services during the COVID-19 pandemic, the pandemic was not associated with a rise in suspected deaths by suicide in 2020 and 2021, see Monthly suicide registers for details. Preliminary national mortality data published by the Australian Bureau of Statistics for 2020 to 2021 show that the rate of death by suicide in Australia was lower in 2020 (12.1 per 100,000 population) and 2021 (12.0) than in 2019 (13.1), see Deaths by suicide over time.
Deaths referred to the coroner where initial investigation points to suicide are referred to as ‘suspected deaths by suicide’. In some cases, it can take a number of years for the coronial process to determine if suicide was the cause of a specific death. These data are not directly comparable with coroner-certified deaths as reported on the Suicide and Self-Harm Monitoring System or published by the Australian Bureau of Statistics as Causes of Death, Australia.
Use of mental health services
Since April 2020, the AIHW has compiled and reported mental health-related data. This reporting commenced as part of the National Suicide and Self-harm Monitoring Project. Data from the Medicare Benefits Schedule (MBS), Pharmaceutical Benefits Scheme (PBS), and crisis and support organisations (Lifeline, Beyond Blue, Kids Helpline) were collected weekly in 2020, fortnightly in 2021 and monthly in 2022. These data are shared within government to inform the mental health response to the COVID-19 pandemic. The most current data are available at Mental health services in Australia.
Increased demand for mental health services and crisis and support organisations between 2020 and 2022
These data show that since the onset of the COVID-19 pandemic, overall, there has been a substantial increase in the use of crisis and support organisations (as measured by the number of calls or other contacts, such as webchat or email) and mental health-related services (as measured by MBS and PBS claims processed). The extent to which this increase in demand has been driven by a rise in psychological distress (rather than an increase in people seeking assistance for other reasons, such as loneliness or concern about contracting COVID-19) is unclear. However, given a range of survey data indicate that the average level of psychological distress rose in Australia in 2020 and 2021 from pre-pandemic levels (see psychological distress below), increased demand for mental health-related services and crisis and support organisations is almost certainly indicative of an increase in the need for mental health support and assistance as a result of the pandemic.
Psychological distress
Psychological distress is commonly measured using the Kessler Psychological Distress Scale – 10 items (K10). The K10 questionnaire was developed to yield a global measure of psychological distress, based on questions about people’s level of nervousness, agitation, psychological fatigue and depression in the past 4 weeks. The Kessler 6 Scale is an abbreviated version of K10.
There is an association between high levels of psychological distress and serious mental health disorders. As a result, instruments such as K10 and K6 can be used in representative sample surveys as a broad indicator of the level of these disorders in the Australian population (Slade, Grove & Burgess 2011). This is important, as there is an association between mental health issues and deaths by suicide. Data from the Queensland Suicide Register for 2016–2018 based on police and coroners reports, show that 53% of people who died from suicide reportedly had a mental health condition (Leske et al. 2022). Leske et al. (2022) note that this is likely to be an underestimate. Australia wide, just under 63% of people who died by suicide in 2021 had a recorded mental and behavioural disorder as an associated cause of death (ABS 2022a).
There are several ways to gain insights into the level of psychological distress in the community and monitor trends over time.
One way is to look at trends in severe levels of psychological distress through the use of mental health and crisis support services. The AIHW has compiled data on the use of mental health services and crisis and support organisations during the COVID-19 pandemic. The most current data are available at MHSA. However, while this approach is useful, it is not a direct measure of the level of psychological distress in the population. It also does not capture those who choose not to seek assistance or those who cannot access mental health services or crisis and support organisations.
Another way to analyse trends in the level of psychological distress since the onset of the pandemic is to use sample surveys. This approach has been challenging since the onset of COVID-19 due to the fact that face-to-face surveys are very difficult to undertake at this time and pose a potential health and safety risk to interviewers and interviewees. This has led to a number of online surveys being conducted but many of these surveys are not based on probability sampling. In some cases, samples are drawn by inviting all members of the public above a certain age to respond, with unknown response rates. Other samples are drawn from panels where individuals opt-in online. While this sort of approach can provide some useful information, results are unlikely to be representative of the Australian population and therefore cannot be used, even with reweighting, to derive estimates for the Australian population. A major report on online panels for the American Association for Public Opinion Research (AAPOR 2010) noted that:
Researchers should avoid nonprobability online panels when one of the research objectives is to accurately estimate population values. There currently is no generally accepted theoretical basis from which to claim that survey results using samples from nonprobability online panels are projectable to the general population. Thus, claims of “representativeness” should be avoided when using these sample sources.
Given the need for representative data, the AIHW collaborated with the Centre for Social Research and Methods at the Australian National University to include questions on loneliness and levels of psychological distress in the ANUpoll surveys, which collect data using the Life in AustraliaTM Panel. Importantly, this panel uses random probability-based sampling methods and covers both online and offline populations (that is, people who do and do not have access to the internet). In addition, ANUPoll data collected between January 2020 and January 2021 were used to develop a longitudinal dataset. This longitudinal data set enables changes in the experience of an individual to be measured across this period (Biddle 2021a). Data on psychological distress during the COVID-19 pandemic have been collect in April, May, August, October and November 2020, January, April, August and October 2021, January, April, August, October 2022, and January 2023.
Pre COVID-19 snapshot
To understand how COVID-19 may have affected Australians’ levels of psychological distress, it is important to look at data from before the pandemic. It is particularly important to consider any existing trends prior to the pandemic – for example, if psychological distress was generally increasing among Australians in the years before the pandemic.
This is possible using results from the Australian Bureau of Statistics’ National Health Survey (NHS), which is conducted approximately every 3 years. Tables 1 to 3 show the proportion of males, females and people with high or very high levels of psychological distress, as measured by the Kessler 10 Scale, from 2004–05 to 2017–18. While the results vary by age, there is no consistent trend over this period. It is worth noting, however, that young women aged 18–24 generally have higher levels of psychological distress than other age groups. Overall, between 2011–12 to 2017–18 there appears to have been small increases in the proportion of both males and females with high or very high levels of psychological distress.
The National Drug Strategy Household Survey (NDSHS) also showed an increase in the proportion of people reporting high or very high levels of psychological distress; from 10% in 2010 to 14% in 2019 (AIHW 2020).
18–24 | 25–34 | 35–44 | 45–54 | 55–64 | 65–74 | 75+ | Total | |
|---|---|---|---|---|---|---|---|---|
2004–05 | 15.5 | 11.8 | 14.9 | 13.7 | 12.2 | 11.2 | 10.7 | 13.0 |
2007–08 | 11.8 | 12.3 | 11.5 | 13.2 | 13.2 | 9.0 | 10.8 | 12.0 |
2011–12 | 11.8 | 10.9 | 10.9 | 11.4 | 10.4 | 9.3 | 9.3 | 10.8 |
2014–15 | 15.4 | 10.9 | 11.9 | 12.4 | 11.0 | 10.1 | 9.7 | 11.7 |
2017–18 | 15.2 | 13.1 | 11.8 | 14.3 | 14.4 | 10.7 | 8.8 | 13.0 |
Source: ABS 4364.0.55.001 - National Health Survey
18–24 | 25–34 | 35–44 | 45–54 | 55–64 | 65–74 | 75+ | Total | |
|---|---|---|---|---|---|---|---|---|
2004–05 | 12.4 | 9.3 | 11.4 | 11.0 | 11.3 | 9.8 | 10.8 | 10.8 |
2007–08 | 6.5 | 10.9 | 8.8 | 11.1 | 11.6 | 7.4 | 8.8 | 9.6 |
2011–12 | 10.6 | 8.2 | 9.1 | 8.9 | 8.8 | 7.0 | 7.8 | 8.8 |
2014–15 | 11.1 | 9.8 | 10.0 | 9.2 | 9.8 | 9.7 | 9.0 | 9.9 |
2017–18 | 12.4 | 11.8 | 10.3 | 13.2 | 12.1 | 10.0 | 7.5 | 11.3 |
Source: ABS 4364.0.55.001 - National Health Survey
| 18–24 | 25–34 | 35–44 | 45–54 | 55–64 | 65–74 | 75+ | Total |
|---|---|---|---|---|---|---|---|---|
2004–05 | 18.7 | 14.3 | 16.6 | 16.3 | 13.1 | 12.5 | 10.7 | 15.1 |
2007–08 | 17.4 | 13.9 | 14.2 | 15.3 | 14.7 | 10.6 | 12.3 | 14.3 |
2011–12 | 13.0 | 13.6 | 12.7 | 13.8 | 11.9 | 11.6 | 10.5 | 12.7 |
2014–15 | 20.0 | 11.7 | 13.7 | 15.4 | 12.3 | 10.3 | 10.6 | 13.5 |
2017–18 | 18.4 | 14.7 | 13.7 | 15.3 | 16.9 | 11.3 | 9.7 | 14.5 |
Source: ABS 4364.0.55.001 - National Health Survey
Psychological distress during COVID-19
The Australian Bureau of Statistics’ National Study of Mental Health and Wellbeing, 2020–21 showed that 15% of Australians aged 16–85 experienced high or very high levels of psychological distress as measured by the Kessler 10 scale in 2020–21 (ABS 2022b). However, being from a different survey, these results are not directly comparable with the pre-COVID-19 results from the NHS or NDSHS.
The ANUpoll collected data on psychological distress using the K6 scale prior to and during the COVID-19 pandemic. Data were collected from 2,500 respondents in 2017 (February). Data were collected from over 3,000 respondents for each of the ANUpoll’s administered during 2020 (April, August, October and November), 2021 (January, April, August and October), 2022 (January, April, August and October), and 2023 January.
Prevalence of ‘severe’ psychological distress from 2020 to 2023
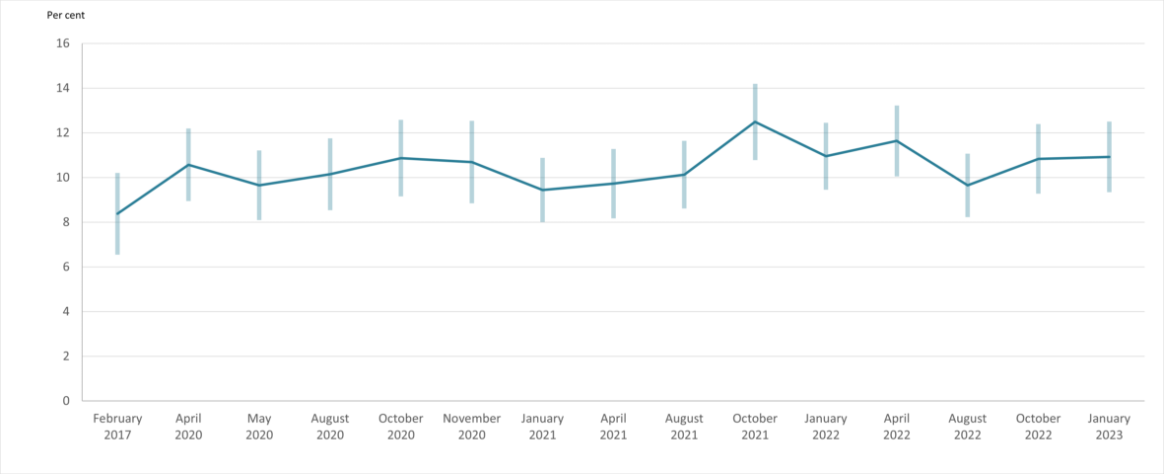
The K6 scale can be used to categorise those survey respondents experiencing ‘severe’ psychological distress, consistent with having a ‘probable serious mental illness’ according to their K6 score (Prochaska et al. 2012). Figure 1, below, shows the proportion of people experiencing severe psychological distress for each of wave of the ANUpoll during the COVID-19 pandemic as well as prior to the pandemic in February 2017.
Results of the surveys show that the proportion of the population experiencing severe psychological distress rose from 8.4% (of people aged 18+) in February 2017 to 10.6% in April 2020 (Biddle et al. 2020b) with a subsequent fall to 9.7% in May 2020 followed by an increase to 10.9% in October 2020, and a substantial decrease to 9.4% in January 2021 (Biddle & Gray 2021b). The proportion of people experiencing severe psychological distress in August 2021 (10.1%) was similar to April 2021 (9.7%) and continued to be significantly higher than in February 2017 (8.4%) (Biddle et al. 2021c). Between August and October 2021, there was a large and statistically significant increase in the proportion of Australians experiencing severe psychological distress from 10.1% to 12.5%. At 12.5% in October this proportion was at its highest level recorded since the onset of the COVID-19 pandemic (Biddle et al. 2021d). The proportion of people experiencing severe psychological distress declined to 11.0% in January 2022, increased slightly to 11.6% in April 2022 (Biddle 2022a,b), before declining again in August 2022 to 9.7%. (Biddle, McAllister and Sheppard 2022). The proportion of Australians experiencing severe psychological distress again increased to 10.8% in October 2022 (Biddle 2022c). In January 2023, 10.9% of Australian’s experienced severe psychological distress (Biddle & Gray 2023).
While the percentage changes in the proportion of Australians experiencing severe psychological distress between 2020 and January 2023 may appear to be small, a change of 1% point represents a change in the experience of approximately 200,000 people. This calculation is based on the June 2021 estimated resident adult Australian population of about 20,000,000 people (ABS 2022c).
Figure 1: Proportion of Australians aged 18 years and over experiencing severe psychological distress, by survey month from February 2017 to January 2023
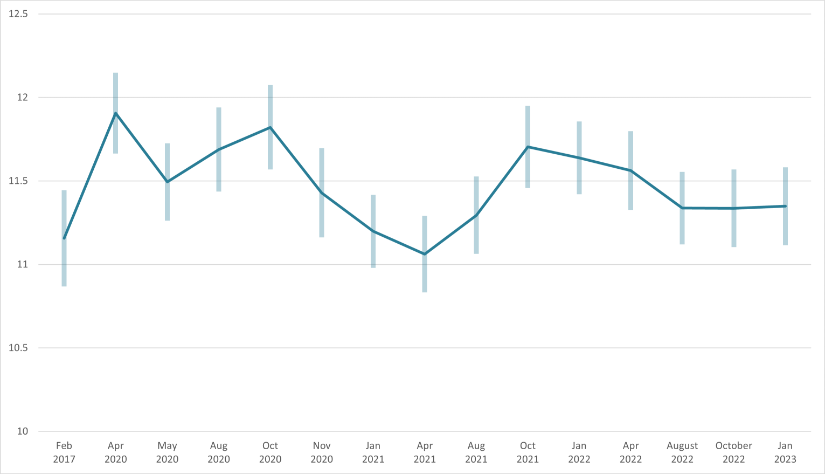
Average psychological distress (K6 score) in 2020, 2021 and 2022
Another way of analysing trends in psychological distress is to look at how the average K6 score has changed over time. The data show some notable changes in the average level of psychological distress between 2020 and 2023, with marked differences by age and some variation by gender and jurisdiction. The K6 measure of psychological distress used in the analysis prepared by the ANU has been constructed to have a minimum value of 6 and a maximum value of 30 (Biddle et al. 2020c). Higher scores indicate higher average levels of distress. People with a sum of 11–18 out of a possible maximum of 30 are categorised as experiencing ‘moderate’ psychological distress. This group can be considered to be struggling with mental distress worthy of mental health support but are not at risk of clinical levels of mental health problems (Prochaska et al. 2012). Those with a K6 sum of 19 or higher out of a possible maximum of 30 are categorised as experiencing ‘severe’ psychological distress consistent with having a ‘probable serious mental illness’.
In February 2017, the average K6 score was 11.2. In April 2020, it increased to 11.9. Between April and May 2020 there was a significant reduction in psychological distress (to an average score of 11.5); however, the score remained above the pre-COVID-19 level of February 2017. The average score rose from 11.5 in May 2020 to 11.7 in August 2020 but showed very little change from August to October 2020 (11.8) (Biddle & Gray 2020). This was followed by a large and statistically significant fall in the average K6 score from October to November 2020 (11.4) (Biddle et al. 2020e). While the average score in November 2020 was quite a bit lower than it was in April 2020 it was higher than it was prior to the onset of COVID-19 in February 2017.
From November 2020 to January 2021, the average K6 score fell from 11.4 to 11.2 and continued to decline to 11.1 in April 2021 (Biddle & Gray 2021b). In August 2021, following the most recent outbreak of COVID-19, the average K6 score increased (worsened) to 11.3 but remained lower than scores recorded in April to October 2020. The increase in psychological distress between April and August 2021 was greater for women than men (after controlling for levels of psychological distress in April 2021). Also, after controlling for other factors, women had higher levels of psychological distress in August 2021 compared with men (Biddle & Gray 2021c).
The average level of psychological distress in August 2021 (11.3) was not significantly different to the pre-pandemic level (11.2) observed in February 2017 (Biddle & Gray 2021c). In other words, the average level of psychological distress had returned to pre-pandemic levels. That said, however, there were differences by age (Figure 3).
Between August and October 2021, the average level of psychological distress increased significantly from 11.3 to 11.7 but remained lower than the peaks April and October 2020 (11.9 and 11.8, respectively) (Biddle & Gray 2021d). The worsening of psychological distress between August and October 2021 was due to increases among people aged 18 to 44 years and 75 years and older (Figure2). Between October 2021 and January 2022, there was a slight but not statistically significant decline in average psychological distress from 11.7 to 11.6 (Biddle & Gray 2022). Average psychological distress remained at 11.6 in April 2022 (Biddle 2022b). There may have then been a small decline in average psychological distress to 11.3 during August 2022 (Biddle, McAllister and Sheppard 2022). Average psychological distress remained stable at 11.3 in October 2022 and January 2023 (Biddle 2022c; Biddle & Gray 2023). Since August 2022, average psychological distress has no longer been significantly higher than the pre-COVID-19 level of February 2017 (p10., Biddle & Gray 2023).
Figure 2: Average psychological distress of Australians aged 18 years, by survey month from February 2017 to January 2023
Psychological distress by age
Figure 3 shows average K6 scores by age groups. The chart shows a clear gradient with younger people experiencing higher average levels of psychological distress than people in older age groups (Biddle et al. 2020c,d; Biddle & Gray 2020; Biddle & Gray 2021a,b,c,d). The chart also shows a distinct pattern over time. For younger people (18–44), average levels of psychological distress were higher in 2020, 2021 and January and April 2022 than they were before the pandemic, especially for those aged 18–24. Those aged 45 and above experienced either little change or improvements in their level of psychological distress over the same period. As an example, the average levels of psychological distress among those aged 18–24, 25–34 and 35–44 were significantly higher in April 2020 than in February 2017 (Biddle et al. 2020c). However, it is worth noting there were improvements during the course of 2020. For example, the level of psychological distress among those aged 18–24 showed a significant improvement from October to November 2020 (Biddle et al. 2020e). Furthermore, average levels of distress for people within the younger age groups (18–24, 25–34 and 35–44 years) appear to have either lowered or remained relatively stable between April 2022 and January 2023 (Biddle 2022c; Biddle & Gray 2023; Biddle, McAllister and Sheppard 2022).
Figure 3: K6 measure of psychological distress, by age group and selected survey months from February 2017 to January 2023
This figure shows the average K-6 measure of psychological distress by age group for February 2017, April 2020, October 2021 and April 2022. For young Australians (18 to 24 years old in particular, but also all those aged under 45), there was a worsening in psychological distress between February 2017 and April 2020. Although there were improvements in psychological distress in these age groups, psychological distress remained higher in October 2021 and April 2022 than it was in February 2017. For those aged 55 years and over, average levels of psychological distress were slightly lower in April 2022 than in February 2017

Demographic factors associated with psychological distress during the COVID-19 pandemic
An advantage of the ANUpoll data is that longitudinal data are available for a proportion of respondents and therefore, the impacts of the COVID-19 pandemic and associated factors can be measured in the same respondents over time. Biddle et al. constructed a statistical (regression) model to investigate the possible impacts of the COVID-19 pandemic on psychological distress, as measured by the K6, from April 2020 to April 2022 (Biddle et al. 2022). The model also included measures of mental health, other than the K6, from the February 2020 ANUpoll to control for pre-pandemic levels of psychological distress. It was necessary to use other mental health measures because, prior to April 2020, the most recent ANUpoll to include the K6 was conducted in April 2017 and the remaining longitudinal sample from this time is insufficient as a baseline for the present regression analysis. The analysis showed that over the experience of the pandemic between April 2020 and April 2022 (Biddle et al. 2022):
- females had significantly higher levels of psychological distress than males
- Aboriginal and Torres Strait Islander Australians had higher levels of psychological distress than non-Indigenous Australians, although the difference was not statistically significant
- Victorians had higher levels of psychological distress than residents of New South Wales (the base case).
- household income was associated with psychological distress, with higher levels of psychological distress experienced by those living in lower income households.
What contributed to increased levels of psychological distress?
The heightened level of psychological distress in April 2020 coincided with the first wave of COVID-19 infections in Australia and the initial lockdown period, while the improvement from April to May 2020 coincided with the loosening of restrictions. The increase in the level of psychological distress between May and August 2020 coincided with the second wave of COVID-19 in Victoria and the associated lockdown – with much of the worsening in the average K6 score over this period reflecting changes in Victoria (Biddle & Gray 2020).
To test whether outcomes worsened in Victoria relative to the rest of the country after the reintroduction of lockdowns in July 2020, Biddle et al. conducted a difference-in-difference analysis using linked data for May and August (that is, data across these months for the same people) (Biddle et al. 2020d). This showed a significant worsening in Victoria relative to the rest of the country on several outcomes including: psychological distress, loneliness, life satisfaction, satisfaction with direction of country, likely to be infected by COVID-19 and hours worked). On the other hand, the decrease in levels of psychological distress from October to November 2020 coincided with improvements in Victoria. According to Biddle et al. (2020e):
There has also been a continued convergence in psychological distress between Victoria and the rest of Australia. In October 2020, just as lockdown conditions had started to be eased, psychological distress in Victoria was more than 1-point higher in Victoria compared to the rest of Australia (12.67 compared to 11.52). By November 2020, however, this difference had declined to less than half of one point – 11.73 compared to 11.32.
In 2021, the worsening of psychological distress between April and August was greater for residents of Sydney and Melbourne, than those living in the rest of Australia (Biddle & Gray 2021c). The increase in psychological distress from August to October did not show a clear geographic pattern.
To investigate the factors that appeared to be contributing to the rises in psychological distress Biddle et al. undertook regression modelling of the ANUpoll longitudinal subset (Biddle et al. 2020c). Modelling of ANUpoll data collected from the same respondents in February 2017, April 2020 and May 2020 showed that the strongest predictor of psychological distress (K6 score) was ‘increased (worsened) stress’ (this is not surprising as stress is a key predictor of poor mental health outcomes) (Biddle et al. 2020c). ‘Increased loneliness’ was also a strong predictor of K6 scores even when other factors like changes in employment status were controlled for. This suggests that increased loneliness during the pandemic is of concern and that increases in psychological distress are not only being driven by job loss.
Job loss itself was a predictor of K6 scores in the modelling (Biddle et al. 2020c). Controlling for other factors, people who were employed in February 2020 but not in May 2020 had higher levels of psychological distress than those who were employed. In all the models, those living outside capital cities had lower rates of psychological distress than those living in capital cities, after controlling for other factors (Biddle et al. 2020c). This is probably a reflection of the fact that infection rates and the economic impacts of lockdowns have been higher in major cities than they have been in regional or remote areas.
After controlling for factors such as ‘relationships worsening’, ‘increased stress’ and ‘loss of employment’, there was no significant difference in K6 scores between young people (18–24) and older people. This suggests that these factors were the drivers of higher levels of psychological distress among young people.
One final point worth noting is that in the regression analysis of K6 scores, previous K6 scores in February 2017 had a significant predictive effect on K6 scores for May 2020 (Biddle et al. 2020c). This shows that people who are already experiencing high levels of psychological distress can be particularly vulnerable when the situation worsens.
As the COVID-19 pandemic continues, it becomes less clear whether pandemic related factors or other socioeconomic factors may be primarily responsible for any community level change in psychological distress. In the August and October 2022 and January 2023 ANUPolls, respondents were asked whether they ‘felt anxious or worried for the safety of yourself, close family members or friends, due to COVID-19’. Responses to this question provide some information as to whether distress experienced is related to the COVID-19 pandemic or to other factors. In August 2022, 48.3% of respondents reported feeling anxious or worried due to COVID-19. In October 2022, this dropped to 29.8% of respondents, and in January 2023 34.3% of respondents reported feeling anxious or worried due to COVID-19 (Biddle 2022c; Biddle & Gray 2023; Biddle, McAllister and Sheppard 2022).
Loneliness
The ANUpoll also asked respondents whether ‘In the past week, how often have you felt lonely?’ Analysis summarised in Biddle et al. (2020c) shows that those who experienced loneliness had higher rates of psychological distress than those who did not.
Between April 2020 and May 2020, there was a significant decline in experiences of loneliness overall, with 36.1% of the sample saying that they experienced loneliness at least some of the time in May 2020, compared with 45.8% in April 2020 (Biddle et al. 2020c). Declines in loneliness were consistent by age and sex, with the exception of young people (aged 18–24) who did not have a statistically significant reduction in the level of loneliness from April to May 2020 – despite the fact that they had the highest proportion of respondents saying that they felt lonely at least some of the time in April 2020 (63.3%) (Biddle et al. 2020c).
There was a rise in reported loneliness from 36.1% in May 2020 to 40.5% in August 2020 (Biddle et al. 2020d). However, this rise only occurred in Victoria where the proportion of the population who were lonely at least some of the time increased from 35.7% in May 2020 to 44.5% in August 2020; in ‘the other seven States and Territories, there was no significant difference between loneliness in May 2020 (37.1%) and August 2020 (38.8%)’ (Biddle et al. 2020d). The increase in loneliness from May 2020 to August 2020 in Victoria coincided with the lockdown associated with the second wave of COVID-19 infections.
Females were more likely to report experiencing loneliness than males (44.8% of females compared with 35.7% of males in August 2020). The proportion of young people aged 18–24 years who were experiencing loneliness in August 2020 was also higher than for other ages groups (Biddle et al. 2020d).
The proportion of Australians who said that they had experienced loneliness at least some of the time declined from 40.5% in August 2020 to 35.2% in November 2020 (Biddle et al. 2020e). This is the lowest value observed over the pandemic period so far. In addition, according to Biddle et al (2020e):
There has been a very large decline in the proportion of Australians who said that they ‘never met socially with friends, relatives or work colleagues’ since the early days of the pandemic. In April 2020, 49.4% of Australians said they ‘never met socially’. This declined to 26.5% by May 2020, and even further to 6.8% in November 2020. While this is a dramatic change over a reasonably short period of time, the level of social isolation in November 2020 is still above the pre-pandemic level of 2.0 per cent [recorded in February 2020].
The proportion of Australians who said that they had experienced loneliness at least some of the time remained consistent from November 2020 (35.2%) to January 2021 (36.1%) and April 2021 (35.5%) and increased slightly in August 2021 (37.6%) (Biddle & Gray 2021a & c). However, the increase in loneliness in August 2021 was mainly due to a large increase in Sydney, with the proportion of Sydney residents experiencing loneliness at least some of the time increasing from 35.3% in April 2021 to 44.3% in August 2021, while the rest of Australia reported little change in this period (34.6% in August 2021 compared with 34.0% in April 2021). At the time of the August 2021 survey, Sydney had been in lockdown for the longest amount of time during the COVID-19 Delta strain outbreak. The proportion of Australians who said that they had experienced loneliness at least some of the time increased in October 2021(39.2%) (Biddle 2021b) and then decreased in January 2022 (38.2%) and April 2022 (36.5%) (Biddle 2022a,b) but remained above the lows from November 2020 to April 2021.
Loneliness has a clear impact on levels of psychological distress and life satisfaction. In a regression analysis of data from the November 2020 ANUpoll (that controlled for psychological distress in April 2020) those who felt lonely ‘some’, ‘occasionally’ or ‘most’ of the time all had significantly higher levels of psychological distress than others (Biddle et al 2020e). This suggests that reductions in loneliness may contribute to reductions in levels of psychological distress. Similar results are evident for life satisfaction – that is, after controlling for life satisfaction in April 2020, people who reported feeling lonely at least some of the time had significantly lower levels of life satisfaction than others.
As with average levels of psychological distress over the pandemic period, loneliness also differed by population group. Biddle et al. calculated an average loneliness score across the 10 ANUpoll survey waves from April 2020 to April 2022 (Biddle et al. 2022). Regression analysis was then undertaken to examine the factors associated with average loneliness over the pandemic period and differences between population groups. The regression model included a measure of social interaction from the February 2020 ANUpoll to control for pre-pandemic loneliness. The results of the model showed that during the pandemic period (Biddle et al. 2022):
- females were slightly more likely to experience loneliness than males, although the difference was not statistically significant
- respondents aged 45 and over had substantially lower levels of loneliness than those aged under 45
- those in the lowest income households had the highest levels of loneliness, compared with those in higher income households
- Victorians seemed to experience similar levels of loneliness as residents of New South Wales and South Australians experienced lower levels of loneliness compared with New South Wales (the base case)
The most recent ANUpolls show that the proportion of Australians’ who were lonely at least some of the time during August 2022, October 2022, and January 2023 was 35.6%, 35.9%, and 35.4% respectively (Biddle 2022c; Biddle & Gray 2023; Biddle, McAllister and Sheppard 2022).
Life satisfaction
Another way of tracking wellbeing is to analyse changes in life satisfaction. In the ANUpoll surveys life satisfaction is measured on a scale of 1 to 10, with higher scores indicating higher levels of satisfaction. Average life satisfaction scores fell substantially during the early stages of the pandemic from 6.9 in January 2020 to 6.5 in April 2020, before rising to 6.8 in May 2020 as infection rates fell and lockdown conditions started to be eased (Biddle et al. 2020d). The average level of satisfaction then fell to 6.6 in August 2020. However, between October and November 2020, life satisfaction improved substantially from an average score of 6.7 to 7.0. The average life satisfaction score was no longer significantly different to that recorded in October 2019 (7.1), and was slightly higher than that recorded during the Black Summer Bushfire crisis (6.9 in January 2020) (Biddle et al. 2020e).
Although the overall level of life satisfaction in November 2020 had returned to pre-pandemic levels (October 2019) there was a substantial reduction in life satisfaction scores during 2020. A regression analysis conducted in November 2020 using the longitudinal nature of the ANUpoll data, suggested that after controlling for the level of life satisfaction in January 2020, the total loss of life satisfaction over 2020 was:
- significantly higher for people living in Victoria compared with the rest of the Australian population
- lower for those aged 55 years and over compared with those aged 35–44
- lower for those who living outside the capital cities (Biddle et al. 2020e).
This is consistent with what you would expect given the greater impact of, among other things, lockdowns (through, for example, their impact on employment) for younger people, people in Victoria and people living in capital cities.
Nationally, the average life satisfaction score showed little change from November 2020 (7.0) to January 2021 (7.0), and then declined slightly to 6.9 in April 2021, although the difference was not statistically significant (Biddle & Gray 2021a,b).
In August 2021, the average life satisfaction score in Australia decreased substantially to 6.5, to a level similar to that reported in April 2020 at the peak of the first wave of COVID-19 in Australia and was lower than all other time points measured by ANUpoll (Biddle & Gray 2021c). In order to demonstrate the magnitude of the decline in life satisfaction between April and August 2021, Biddle & Gray (2021c) converted the decline into income equivalents, based on the relationship between life satisfaction and household income prior to the pandemic. This model estimated that the decrease in life satisfaction reported between April and August 2021 was equivalent to a loss of $827 in average weekly household income (Biddle & Gray 2021c).
There was a slight increase in life satisfaction between August 2021 and October 2021, from 6.5 to 6.6. The October ANUPoll was conducted in mid-October when COVID-19 restrictions were beginning to be lifted. Life satisfaction remained at 6.6 in January 2022 and increased slightly to 6.7 in April 2022, still lower than the levels observed pre-pandemic and from November 2020 to April 2021 (Biddle 2022a,b, Biddle & Gray 2021d).Unlike psychological distress and loneliness, life satisfaction was included in the January 2020 ANUpoll, which can be used as a pre-pandemic baseline. Average life satisfaction over the pandemic period has mostly been lower than before the pandemic in January 2020 (noting that life satisfaction was lower in January 2020 when bushfires were affecting large parts of Eastern Australia than it was in October 2019) (Biddle et al. 2022). Biddle et al. calculated average loss of life satisfaction during the pandemic period for respondents to the April 2022 ANUpoll, using the January 2020 ANUpoll as the baseline and data from the ANUpoll surveys conducted between April 2020 and April 2022 (Biddle et al. 2022). The calculation assumes that had the COVID-19 pandemic not occurred, life satisfaction would have remained at January 2020 levels. The average level of ‘lost life satisfaction’ due to the pandemic for respondents to the April 2022 ANUpoll was 0.216, which when converted to income equivalents was roughly equivalent to a halving in income (Biddle et al. 2022).
The impact of the pandemic on life satisfaction differed by age, with the greatest declines among those aged 18 to 24 years, moderate declines for those aged 25 to 54, no significant declines for those aged 55 and over and slight increases for those aged 75 and over (Biddle et al. 2022).
Regression modelling was used to estimate the association between other demographic variables and loss of life satisfaction due to the pandemic. In this model, greater declines in life satisfaction were observed in respondents who had not completed year 12 compared with those who had as well as Victorians compared with residents of New South Wales. Respondents in the 4th and 5th income quintiles (the two highest income groups) had the smallest loss in life satisfaction, compared with other income quintiles (Biddle et al. 2022)
The most recent ANUpolls show that average Australian life satisfaction during August 2022, October 2022, and January 2023 was 6.8, 6.7, and 6.8 respectively (Biddle 2022c; Biddle & Gray 2023; Biddle, McAllister and Sheppard 2022). While life satisfaction has steadily increased since August 2021, it remains lower than November 2020 and pre-COVID-19 during October 2019 (p6., Biddle & Gray 2023).
Data on deaths by suicide
There has been considerable commentary since the start of the pandemic on its potential to impact on the incidence of deaths by suicide. Much of this commentary has been based on modelling using previous experience including the relationship between unemployment and deaths by suicide. However, evidence to-date does not indicate an increase in suicide deaths in Australia during the pandemic. National mortality data published by the Australian Bureau of Statistics show that the rate of death by suicide in Australia was lower in 2020 (12.1 per 100,000 population) and 2021 (12.0) than in 2019 (13.1), see Deaths by suicide over time. That said, Australian Bureau of Statistics coding of psychosocial risk factors associated with deaths by suicide in 2020 determined that 3.2% of these deaths had the pandemic mentioned in either a police or pathology report or a coronial finding. In 2021, the percentage of suicide deaths where the pandemic was mentioned decreased to 2.6%. In most of these cases, other risk factors for suicide were also present. In 2021, the pandemic appeared to impact on people in different ways, including through job loss and financial insecurity as well as general concern or anxiety about societal changes or contacting the virus (ABS 2022a). For more information, visit Family and personal hardship: Psychosocial risk factors and deaths by suicide.
Internationally, a ‘living systematic review’ (John et al. 2021) based on evidence until 19 October 2020, has concluded that:
There was no consistent evidence of a rise in suicide but many studies noted adverse economic effects were evolving. There was evidence of a rise in community distress, fall in hospital presentation for suicidal behaviour and early evidence of an increased frequency of suicidal thoughts in those who had become infected with COVID-19. This living review provides a regular synthesis of the most up-to-date research evidence to guide public health and clinical policy to mitigate the impact of COVID-19 on suicide risk as the longer term impacts of the pandemic on suicide risk are researched.
A study investigating trends in suicide deaths between January 2017 and August 2020, using data from the Queensland, New South Wales, and Victorian suicide registers concluded that (Clapperton et al., 2021):
Although our analysis found no evidence of an overall increase in suicides after the pandemic began, the picture is complex. The identified increase in suicide in young men indicates that the impact of the pandemic is likely unevenly distributed across populations. The increase in suicides in the context of unemployment reinforces the vital need for mitigation measures during COVID-19, and for ongoing monitoring of suicide as the pandemic continues.
Since 2020, suicide registers in Victoria and New South Wales have regularly published data on suspected deaths by suicide for 2019, 2020 and 2021. The Suicide in Queensland: Annual Report 2022 (Leske et al. 2022) included data on suspected deaths by suicide from the interim Queensland Suicide Register (iQSR) from 2019 to 2021. The number of suspected deaths by suicide recorded in suicide registers fluctuates from year to year and, while there have been increases and decreases in some jurisdictions in 2020 and 2021 compared with 2019, there is no evidence to-date that the pandemic has affected suicide rates. For more information see Monthly suicide registers.
While the pandemic does not appear to have affected suicide rates in Queensland compared with previous reports, examination of police reports by the iQSR indicates that between 29 January 2020 and 31 December 2021 COVID-19 appeared to be a contributing factor in 86 of the 1,539 suspected deaths by suicide (5.6%) (Leske et al. 2022).
It is true that some key risk factors associated with deaths by suicide did worsen following the onset of the pandemic. For example, there were considerable job losses and rises in the level of psychological distress. On the other hand, it is possible that a general sense of ‘we are all in this together’ could have a protective impact. From February to April 2020 there were rises in the level of trust in others and in governments in Australia (Biddle et al. 2020a). In addition, the vast majority of people who experience unemployment or high levels of psychological distress or mental health issues will never experience a suicide attempt. That said, it is very important to monitor trends in risk factors and trends in deaths by suicide in real time.
A study undertaken by Leske et al (2021) used Queensland Suicide Register data to compare rates of suspected suicide before the COVID-19 pandemic (2015-2019) to rates of suspected suicide during the earlier months of the pandemic (February 2020-August 2020). Leske et al. (2021) found there was no overall change in the rates of suspected suicide during the first seven months of the pandemic in Queensland. Nonetheless, that COVID-19 had been a contributing factor for some individual suspected suicide deaths that occurred during the period.
Another factor that should be considered is the impact of both JobKeeper and the JobSeeker supplement. This is important given the association between the risk of dying by suicide and socioeconomic outcomes. Modelling undertaken by the ANU suggests that not only were levels of poverty and housing stress lower than they otherwise would have been as a result of these payments, they were also lower than they were prior to the spread of COVID-19 (Philips et al. 2020). Households who mainly relied on the JobSeeker payment prior to the pandemic and the introduction of the JobSeeker supplement saw their poverty rate fall from 67% prior to COVID-19 to 6.8% (Phillips et al. 2020). On a similar note Biddle et al. (2020d) found that real incomes actually rose for those in the bottom decile of the income distribution from February to August 2020. Using data from the Taking the Pulse of the Nation Survey, Botha et al. (2020) have shown that the level of psychological distress among the unemployed declined after May 2020. The ANU modelling suggests that the protective impact of JobKeeper and the JobSeeker supplement on housing stress and poverty were reduced somewhat by the changes to these payments announced in July 2020 (Phillips et al. 2020).
Ambulance attendances
A key part of the National Suicide and Self-harm Monitoring Project is the compilation and coding of data from ambulance attendances. The National Ambulance Surveillance System (NASS), established in 2020, provides data on ambulance attendances for suicidal and self-harm behaviours for New South Wales, Victoria, Queensland, Tasmania and the Australian Capital Territory. The NASS is a partnership between Turning Point, Monash University and jurisdictional ambulance services across Australia. Comprehensive data from the NASS are reported in Ambulance attendances: Suicidal ideation, and suicidal and self-harm behaviours.
In 2020, prior to the establishment of the NASS, the AIHW requested Turning Point prioritise the coding of data for Victoria. Victoria was chosen as monthly data on ambulance attendances were already being compiled for the Victorian Government and there were concerns about the impact of the Melbourne lockdown on suicide and self-harm behaviours.
Monthly data on the number of ambulance attendances related to suicide attempts in Victoria from 2018 to 2020 are shown in Figure 4. As the figure shows, there is no clear difference from 2018 to 2020. The total number of ambulance attendances related to suicide attempts in Victoria in 2020 was 4% lower than in 2019 but 8% higher than in 2018.
In 2020, there was an 11% increase in the total number of ambulance attendances in Victoria relating to suicidal ideation (thinking about suicide), compared with 2019, with the increase more pronounced in the second half of 2020. There was also an increase in the total number of mental health attendances (16% higher in 2020 than in 2019). This is consistent with the overall greater use of mental health services in 2020 that is evident in other data. This highlights the fact that greater use of, and need for, mental health services does not necessarily equate to trends in the number of suicide attempts. The vast bulk of people who use mental health services will never have a suicide attempt but timely access to mental health services may reduce the number of deaths by suicide. The total number of ambulance attendances for self-injury in Victoria in 2020 was considerably higher (33%) than in 2019. This highlights the fact that self-injury and suicide attempts are not the same thing.
Figure 4: Monthly ambulance attendances for suicide attempts, Victoria, 2018 to 2020
