Associations between risk and protective factors, and 12-month self-harm prevalence (irrespective of intent) among 12 to 17-year-olds
About these maps
These maps visualise area level co-occurrence of 12-month self-harm prevalence (irrespective of intent) and a limited number of risk and protective factors. This means looking at the total prevalence of youth self-harm (irrespective of intent) within an area and the prevalence of a risk or protective factor within the same area.
Protective factors are those hypothesised to be associated with lower self-harm prevalence. Risk factors are those hypothesised to be associated with higher self-harm prevalence.
Australian Youth Self-Harm Atlas study authors selected risk and protective factors based on a literature review and expert knowledge. However, the selected factors do not encompass all those potentially relevant to youth suicidality and self-harm. Only three of the eight risk and protective factors included within the Australian Youth Self-Harm Atlas study are presented in this publication.
The co-occurrence of 12-month self-harm prevalence (irrespective of intent) and three of the risk and protective factors are each visualised within separate maps.
The Australian Youth Self-Harm Atlas study risk and protective factors included within this publication are:
- Major depression and anxiety disorders among 12 to 17-year-olds:
Area level proportion of young people, aged 12 to 17 years, who experience anxiety or depression over a 12-month period. Synthetic estimates generated from combining Young Minds Matter (YMM) survey data and 2016 Census data. - Socio-economic decile:
The Area-level Index of Relative Socio-economic Advantage and Disadvantage (IRSAD) decile. Derived from 2016 Census data. Higher IRSAD scores (and deciles) indicate relatively low financial disadvantage and high financial advantage. - Percentage of 12 to 17-year-olds that are male:
Area level proportion of 12 to 17-year-olds that are male. Derived from 2016 Census data.
Interpreting these maps
It is important to remember that these maps do not provide evidence that a risk or protective factor caused lower or higher youth self-harm in an area.
Conclusions can only be drawn about experiences of young people at the level of the geographic area under consideration. No inferences can be made about the experiences of individual young people. See the Data interpretation considerations section of this publication for more information.
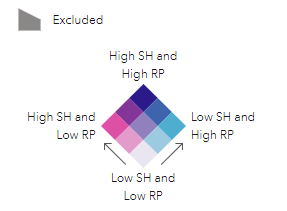
On these maps dark blue colouring represents areas where both self-harm and the factor of interest have higher prevalence (i.e. a strong positive association).
Dark pink colouring represents areas where self-harm prevalence is high, and the risk/protective factor of interest is low (i.e. a strong negative association).
The strong aqua colouring represents areas where self-harm prevalence is low, and the risk/protective factor of interest is high.
The off-white colouring represents areas where both self-harm and the risk/protective factor of interest have lower prevalence.
Grey colouring indicates that an estimate was not generated for that area due to insufficient data.

Both self-harm and the risk or protective factors are visualised using quantiles cut-offs. Synthetic estimates are available in these maps at SA3 areas only.
These maps show
- There is geographic variation in the relationships between youth self-harm and risk and protective factors across Australia.
- There were differences in the pattern of relationships between youth self-harm and risk and protective factors between regional and metropolitan areas. Generally, there was greater diversity in relationship size and direction among metropolitan areas.
- Major Depression and Anxiety Disorders among young people aged 12 to17 years:
Particularly across remote areas of Western Australia, Northern Territory, South Australia, and Far North Queensland, higher youth self-harm prevalence is associated with higher prevalence of major depression and anxiety disorders among people aged 12 to17 years. However, there are areas where higher self-harm prevalence is associated with lower depression and anxiety prevalence, and vice versa. Predominately within Victoria and Tasmania, there are outer regional and remote areas where lower self-harm prevalence is associated with lower depression and anxiety prevalence.
- Socio-economic Advantage and Disadvantage:
Broadly, lower socio-economic advantage (lower socio-economic decile) was associated with higher youth self-harm prevalence. However, mostly (but not exclusively) within major capital cities, there were areas in which higher socio-economic advantage (higher socio-economic decile) was associated with higher youth self-harm. There are also areas, predominately across western, central, and far north-eastern New South Wales, western Victoria, and Tasmania, where lower socio-economic advantage is associated with lower youth self-harm prevalence.
- Males aged 12 to 17 years:
Most areas in which youth self-harm prevalence is lower and the proportion of 12 to17-year-olds that are male is higher are concentrated across Tasmania, Victoria, and New South Wales. There are also areas, largely across remote Western Australia, South Australia, Far North Queensland, and in proximity to the east coast, where higher youth self-harm is associated with lower proportion of young males, aged 12 to 17 years.


