Indicator 1.3 Waist circumference
Overview
Based on measured data from the 2017–18 National Health Survey (NHS), an estimated 63% of Australian adults had a waist circumference that put them at an increased risk of chronic disease, including type 2 diabetes (94cm or more for men and 80cm or more for women).
Trends
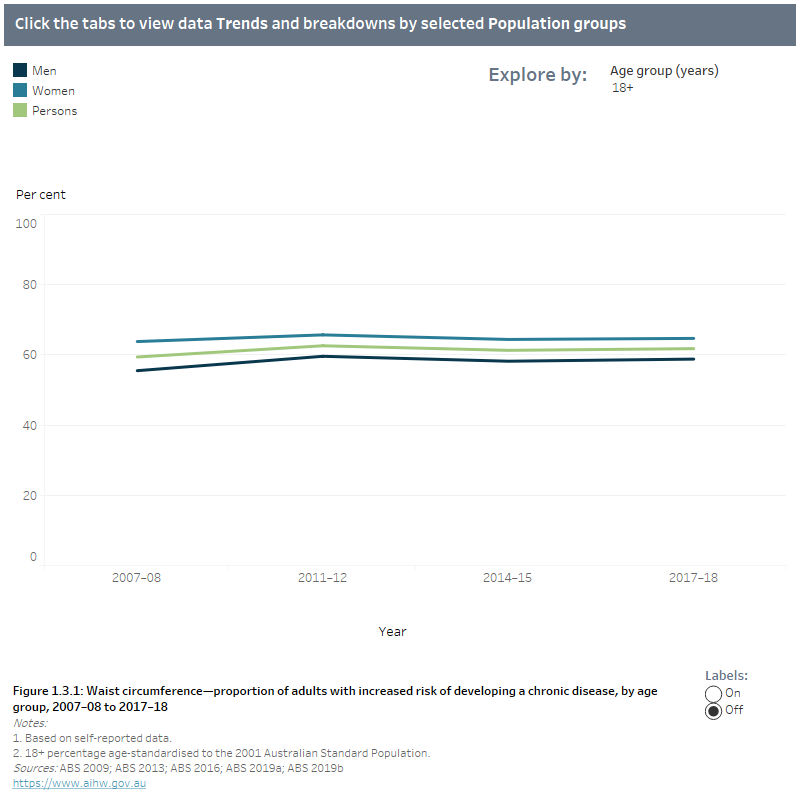
The age-standardised proportion of people with an at-risk waist circumference has remained steady since 2011–12 (Figure 1.3.1).
Age and sex
Women were more likely to have a waist circumference that put them at increased risk of chronic disease than men, after adjusting for age (65% compared with 59%).
The proportion of men and women with an at-risk waist circumference generally increased with age, with 81% of men aged 65–74 and 84% of women aged 75 and over (Figure 1.3.1).
Population groups
The proportion of people with an at-risk waist circumference was higher among those living in the lowest socioeconomic areas compared to those in the highest socioeconomic areas (67% and 55% respectively). Further, the proportion of people at risk increased with remoteness from 61% of people living in Major cities to 65% both for people living in Inner regional and Outer regional and remote areas (Figure 1.3.2).
State and Territory
After adjusting for age, the proportion of Australian adults with an at-risk waist circumference ranged from 61% to 65% among the states and territories in 2017–18 (Figure 1.3.2).
Aboriginal and Torres Strait Islander people
In 2018–19, 71% of Indigenous adults had a waist circumference that increased their risk of chronic disease, based on data from the National Aboriginal and Torres Strait Islander Health Survey (NATSIHS). In this cohort, the age-standardised proportion of Indigenous women was significantly higher than Indigenous men (84% and 65%, respectively) (Figure 1.3.2).
Based on estimates from the NATSIHS and NHS, the age-standardised proportion of Indigenous adults with an at-risk waist circumference was significantly higher compared to non-Indigenous adults (75% compared with 62%, respectively) (Figure 1.3.2).
Explore the data
1.3 Waist circumference—proportion of adults with increased risk of developing a chronic disease, by age group, 2007–08 to 2017–18 and by selected population group, 2017–18
Trends figure 1.3.1 shows the proportion of people with an increased risk of developing a chronic disease, based on waist circumference remained relatively unchanged between 2007–08 and 2017–18 for both men and women.
Population group figure 1.3.2 shows the increasing proportion of chronic disease risk due to waist circumference in 2017–18 by age group from around one-third of men and women aged 18–24 to around three-quarters of men and women aged 75+. Proportions were slightly higher for women than men in all age groups. Proportions were higher among Indigenous Australians and those living in the lowest socioeconomic areas. Proportions increased slightly with along with the level of remoteness from 61% among those living in Major cities (61%) to 65% among those living in Inner regional and Outer regional and remote areas. Among the states and territories, the proportion of adults with an increased risk for chronic disease due to waist circumference was highest in Tasmania (65%) and lowest in the Northern Territory (59%).

|
|
Definition |
Data source |
|---|---|---|
|
Numerator |
Estimated number of adults (18+ years) with a measured waist circumference which increased their risk of developing a chronic disease (≥ 94 cm for men and ≥ 80 cm for women). |
ABS 2019a; ABS 2019b ABS 2016; ABS 2013; ABS 2009.
|
|
Denominator |
Estimated Australian population (18+ years). |
ABS 2019a; ABS 2019b ABS 2016; ABS 2013; ABS 2009. |
Australian Bureau of Statistics (ABS) 2009. Microdata: National Health Survey, 2007–08. ABS cat. no. 4324.0.55.001. Findings based on Expanded Confidentialised Unit Record File analysis. Canberra: ABS.
ABS 2013. Microdata: Australian Health Survey, National Health Survey, 2011–12. ABS cat. no. 4324.0.55.001. Findings based on Detailed Microdata analysis. Canberra: ABS.
ABS 2016. Microdata: National Health Survey, 2014–15. ABS cat. no. 4324.0.55.001. Findings based on Detailed Microdata analysis. Canberra: ABS.
ABS 2019a. Microdata: National Health Survey, 2017–18. ABS cat. no. 4324.0.55.001. Findings based on Detailed Microdata analysis. Canberra: ABS.
ABS 2019b. Microdata: National Aboriginal and Torres Strait Islander Health, Australia, 2018–19. ABS cat. no. 4715.0.55.001. Findings based on Detailed Microdata analysis. Canberra: ABS.


