Indicator 1.5 Insufficient physical activity, by age group
Considerations
Australia's Physical Activity and Sedentary Behaviour Guidelines provide recommendations on the amount and type of physical activity required for health benefits (Department of Health, 2019). Based on the guidelines, insufficient physical activity is defined here as:
- Adults aged 18–64 who did not complete 150 minutes of moderate to vigorous physical activity across 5 or more days in the last week.
- Adults aged 65 and over who did not complete at least 30 minutes of physical activity per day on 5 or more days in the last week.
In 2017–18, the ABS National Health Survey collected information for the first time on physical activity at work. Therefore, results for 2017–18 include physical activity at work. For comparability across the different National Health Surveys, data for trends exclude physical activity at work.
Overview
Based on self-reported data from the National Health Survey (NHS), it was estimated that more than half (55%) of Australian adults aged 18 years and over were insufficiently active in 2017–18.
Trends
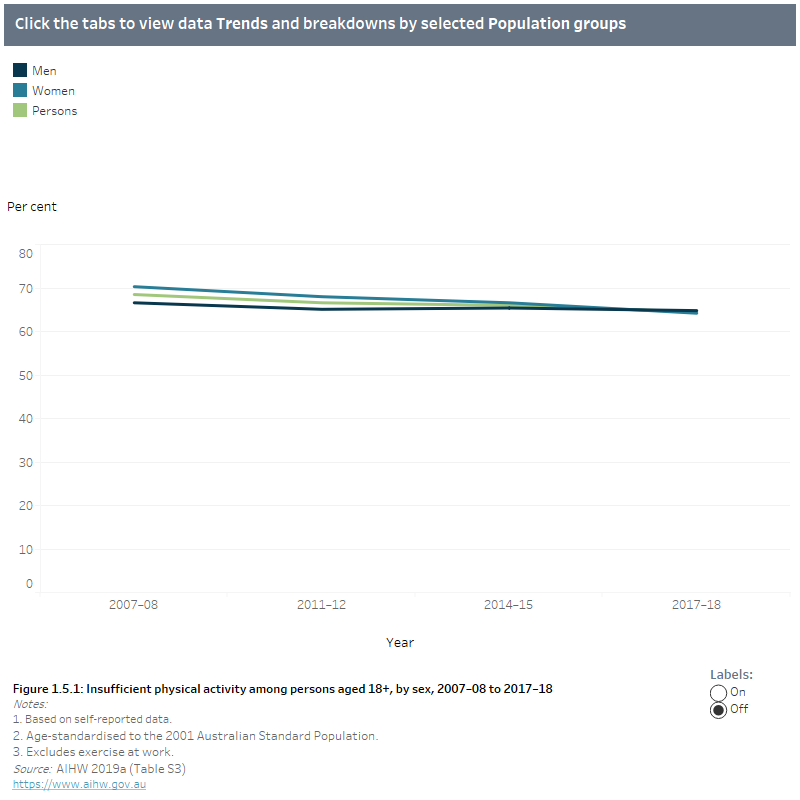
After adjusting for age, there was a slight decrease in the proportion of adults who were insufficiently active between 2007–08 and 2017–18 from 69% to 65%. However rates have not changed since 2011–12. These rates do not include physical activity undertaken at work (Figure 1.5.1).
Age and sex
Women were more likely to be insufficiently active than men (59% compared with 50%) in 2017–18. The rate of insufficient physical activity generally increases with age. It was estimated that around half (51%) of Australian adults aged 18–64 were insufficiently active and 72% of adults aged 65 and over were insufficiently active (Figure 1.5.1).
Population groups
In 2017–18, there were similar levels of insufficient physical activity across remoteness areas with the age-standardised proportion ranging from 54% to 55% between Major cities and Outer regional and remote areas. Over 3 in 5 (63%) Australian adults living in the lowest socioeconomic areas were insufficiently active compared with 48% of those living in the highest socioeconomic areas (Figure 1.5.2).
State and territory
After adjusting for age, the proportion of adults who were insufficiently active ranged from 50% in the Australian Capital Territory to 57% both in Queensland and South Australia in 2017–18 (Figure 1.5.2).
Aboriginal and Torres Strait Islander people
In 2018–19, an estimated two-thirds (60%) of Indigenous Australians were insufficiently active, based on self-reported data from the National Aboriginal and Torres Strait Islander Health Survey (NATSIHS).
The age-standardised proportion of Indigenous adults who were insufficiently active was similar to non-Indigenous adults (62% and 64%, respectively), based on estimates from the 2018–19 NATSIHS and 2017–18 NHS (Figure 1.5.2).
Comparable data on physical activity from the 2018–19 NATSIHS were only collected for non-remote areas and exclude physical activity at work. Results presented for non-Indigenous adults from the NATSIHS exclude remote areas and physical activity at work.
Explore the data
1.5 Insufficient physical activity among persons aged 18+, by sex, 2007–08 to 2017–18 and by selected population groups, 2017–18
Trends figure 1.5.1 shows the overall proportion of Australian adults not meeting the guidelines for physical activity decreased slightly between 2007–08 and 2017–18 from 69% to 65%, excluding exercise at work.
Population group figure 1.5.2 shows the variation in the proportion of men and women not meeting the guidelines for physical activity in 2017–18 by selected population group. Proportions increased with age, peaking in the 65+ age group for both men and women. Proportions were similar by Indigenous status yet increased both with the level of remoteness and socioeconomic disadvantage. Proportions varied slightly among the states and territories, from 50% in the Australian Capital Territory to 57% in both Queensland and South Australia.

|
|
Definition |
Data source |
|---|---|---|
|
Numerator |
Estimated number of adults (18–64 years) who did not complete 150 minutes of moderate to vigorous activity (where vigorous activity is multiplied by 2) on 5 days in the last week. Estimated number of adults (65+ years) who did not complete at least 30 minutes of physical activity per day on 5 or more days in the last week. |
ABS 2019a; ABS 2019b AIHW 2020; AIHW 2019a ; AIHW 2019b
|
|
Denominator |
Estimated Australian population (18+ years). |
ABS 2019a; ABS 2019b AIHW 2020; AIHW 2019a ; AIHW 2019b |
Australian Bureau of Statistics (ABS) 2019a. National Aboriginal and Torres Strait Islander Health, 2018–19. Customised report. Canberra: ABS.
ABS 2019b. National Health Survey, 2017–18. Customised report. Canberra: ABS.
Australian Institute of Health and Welfare (AIHW) 2019a (Table S3). Insufficient physical activity: supplementary online tables. Cat. no. PHE 248. Canberra: AIHW.
AIHW 2019b (Table S1a, S1b, S2a). Insufficient physical activity: supplementary online tables. Cat. no. PHE 248. Canberra: AIHW; AIHW 2020. Australia's health performance framework. Supplementary data table (1.2.5). Canberra: AIHW.
AIHW 2020. Australia's health performance framework. Supplementary data table (1.2.5). Canberra: AIHW.
Department of Health 2019. Australia's Physical Activity and Sedentary Behaviour Guidelines and the Australian 24-Hour Movement Guidelines. Canberra: Australian Government Department of Health. Viewed 13 July 2020.


