Indicator 1.2 Prevalence of type 2 diabetes
Overview
In 2017–18, an estimated (5.4%, or 1 million) Australian adults had type 2 diabetes, based on self-reported data from the Australian Bureau of Statistics (ABS) National Health Survey (NHS).
Trends
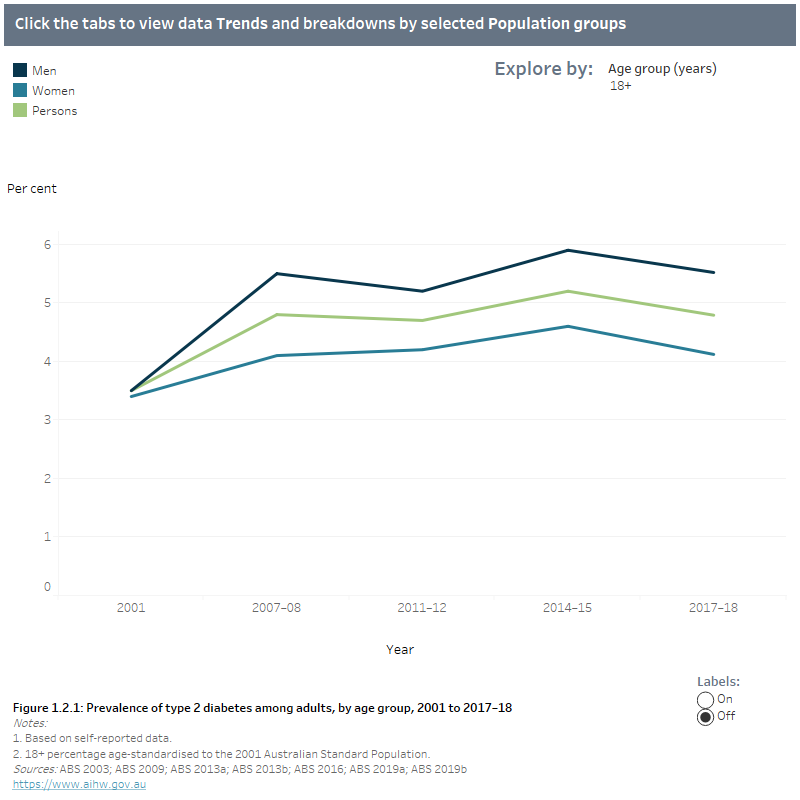
After adjusting for age, the self-reported prevalence of type 2 diabetes increased from 3.5% in 2001 to 4.8% in 2007–08. Between 2011–12 and 2017–18, the prevalence of type 2 diabetes showed a stable pattern—4.7% in 2011–12, 5.2% in 2014–15 and 4.8% in 2017–18 (Figure 1.2.1).
Age and sex
The prevalence of type 2 diabetes increased with age, reaching a peak in those aged 75 and over in 2017–18. Among those 75 and over, around 1 in 6 people (16.6%) had type 2 diabetes. After adjusting for age, the proportion of men with self-reported type 2 diabetes was higher than the proportion of women (5.5% and 4.1%, respectively) (Figure 1.2.1).
Population groups
The age-standardised proportion of people with type 2 diabetes, based on self-reported data from the NHS, was higher among those living in the lowest socioeconomic areas compared with those living in the highest socioeconomic areas (6.9% and 3.4%, respectively) in 2017–18.
After adjusting for age, the prevalence of type 2 diabetes was higher among those living in Outer regional and remote areas compared to those living in Major cities and Inner Regional areas. (Figure 1.2.2).
State and territory
After adjusting for age, the prevalence of type 2 diabetes was highest in the Northern Territory (7.8%) and lowest in Tasmania (4.3%). Other states had age-standardised proportions ranging from 4.5% to 5.6%.
Aboriginal and Torres Strait Islander people
In 2018–19, an estimated 1 in 10 Indigenous adults (10.7% , or 51,900 people) had type 2 diabetes, based on self-reported data from the ABS National Aboriginal and Torres Strait Islander Health Survey (NATSIHS). There was no significant difference between the age-standardised proportion of Indigenous men and women with type 2 diabetes (14.2% and 13.0%, respectively) (Figure 1.2.2).
Based on estimates from the 2018–19 NATSIHS and 2017–18 NHS, Indigenous adults were 2.9 times as likely to have type 2 diabetes as non-Indigenous adults (13.5% compared with 4.7%, after adjusting for age) (Figure 1.2.2).
About the data
In 2011–12 the ABS found that, based on biomedical data, around 1 in 5 people with diabetes were unaware that they had the condition (ABS 2013a). The 1999–2000 Australian Diabetes, Obesity and Lifestyle Study, based on measured blood sugar levels, found that for every known case of diabetes, there was one undiagnosed case (AIHW 2008).
Therefore, the estimates reported here, which are based on self-report, will be an underestimate of the total prevalence of type 2 diabetes in the Australian population. The proportion of people with undiagnosed diabetes has changed over time and this would have impacted on the prevalence of type 2 diabetes in Australia over time.
Explore the data
1.2 Prevalence of type 2 diabetes among adults, by age group, 2001 to 2017–18 and by selected population groups, 2017–18
Trends figure 1.2.1 shows a gradual increase in the prevalence of self-reported diabetes between 2001 and 2014–15 from just over 3% for both men and women to around 6% for men and 5% for women. Among both sexes, the prevalence of self-reported type 2 diabetes remained fairly steady between 2014–15 and 2017–18.
Population group figure 1.2.2 shows the increasing prevalence of type 2 diabetes in 2017–18 by age group from around 1.0% for men and women aged 18–44 to 19% of men and 15% of women aged 75+. The prevalence of diabetes was higher for men than women in all age groups from 45 years and over. The prevalence of type 2 diabetes varied by population group in 2017–18 with higher rates among Indigenous Australians, those living in Outer regional and remote areas and those living in the lowest socioeconomic areas. Prevalence rates were slightly higher in Northern Territory (7.8%) than the other states and territories (all between 4–5%).

|
|
Definition |
Data source |
|---|---|---|
|
Numerator |
Estimated number of adults (18+ years) with self-reported type 2 diabetes. |
ABS 2019a; ABS 2019b ABS 2016; ABS 2013b; ABS 2009; ABS 2003.
|
|
Denominator |
Estimated Australian population (18+ years). |
ABS 2019a; ABS 2019b ABS 2016; ABS 2013b; ABS 2009; ABS 2003. |
Australian Institute of Health and Welfare (AIHW) 2008. Diabetes: Australian facts 2008. Diabetes series no. 8. Cat. no. CVD 40. Canberra: AIHW.
Australian Bureau of Statistics (ABS) 2003. Microdata: National Health Survey, 2001. ABS cat. no. 4324.0.55.001. Findings based on Expanded Confidentialised Unit Record file. Canberra: ABS.
ABS 2009. Microdata: National Health Survey, 2007–08. ABS cat. no. 4324.0.55.001. Findings based on Expanded Confidentialised Unit Record File analysis. Canberra: ABS.
ABS 2013a. Australian Health Survey: biomedical results for chronic diseases, 2011–12. ABS cat. no. 4364.0.55.005. Canberra: ABS.
ABS 2013b. Microdata: Australian Health Survey, National Health Survey, 2011–12. ABS cat. no. 4324.0.55.001. Findings based on Detailed Microdata analysis. Canberra: ABS.
ABS 2016. Microdata: National Health Survey, 2014–15. ABS cat. no. 4324.0.55.001. Findings based on Detailed Microdata analysis. Canberra: ABS.
ABS 2019a. Microdata: National Health Survey, 2017–18. ABS cat. no. 4324.0.55.001. Findings based on Detailed Microdata analysis. Canberra: ABS.
ABS 2019b. Microdata: National Aboriginal and Torres Strait Islander Health, Australia, 2018–19. ABS cat. no. 4715.0.55.001. Findings based on Detailed Microdata analysis. Canberra: ABS.


