< explore study cohort ARTICLES


Study cohort – Older clients in 2014–17

Introduction

Homelessness amongst the older population is an increasing issue in Australia and as such older people are a priority homelessness cohort (see Older people).

Longitudinal analyses have been undertaken for a cohort of older clients (aged 55 years and over) that presented for specialist homelessness services. These analyses are designed to examine SHS service use patterns for a cohort of clients that can be tracked for a relatively similar period into the past and into the future.

See Introduction to the SHS longitudinal data for details on the longitudinal analyses undertaken.

The older cohort (older 2014–17) was defined according to the definition used in AIHW SHS publications such as the SHSC annual report (AIHW 2021). That is, SHS clients that were aged 55 and over in any of their support periods between July 2014 and June 2017 were included in the older 2014–17 cohort.

For these analyses, ‘older people’ have been defined as those aged 55 and over. People aged between 55 and 64 who have suffered homelessness, poverty and disadvantage over long periods of time may experience age related health conditions similar to those over the age of 65 (Dow et al. 2016). In addition, people aged 50 and over suffering job losses can find it difficult to re-enter the labour market due to age discrimination, health problems and family reasons (AHRC 2015). A growing number of mature aged unemployed people who are not yet eligible for the age pension are turning towards income support payments. Department of Social Services payment demographic data for June 2022 indicated that just under 30% of JobSeeker payment recipients were aged 55 and over, with 24% aged 55–64 years and 5% aged 65 and over (up from 22% receiving Newstart in June 2016 who were aged 55–64 years) (DSS 2022).

A comparison cohort (non-older cohort) was also created, comprising adult SHS clients aged between 18 and 54 years in all of their support periods in 2014–17.

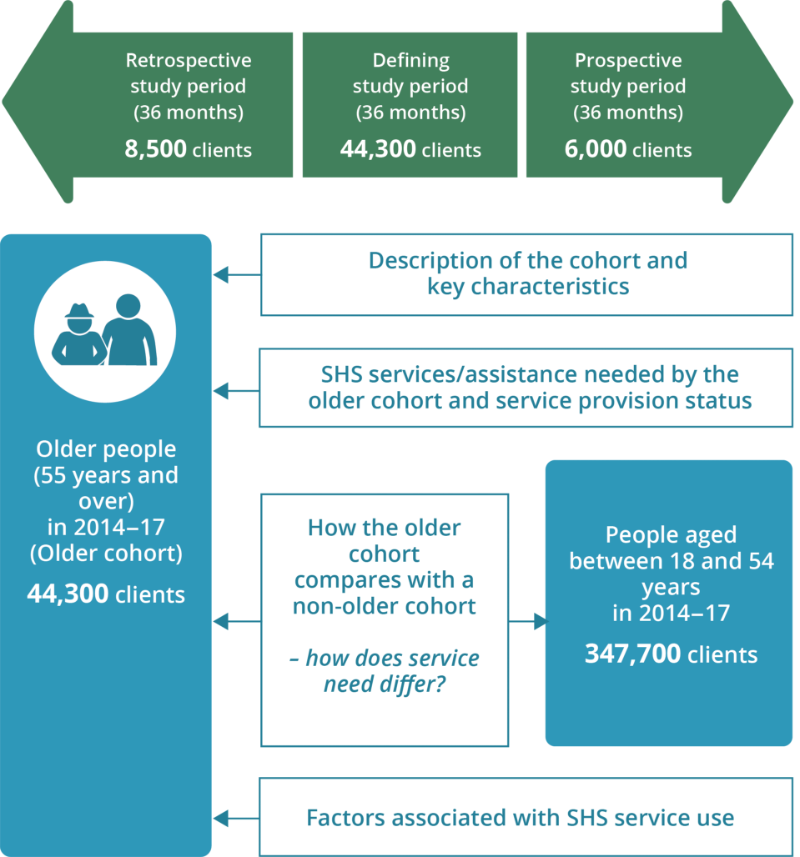
The longitudinal SHS data for the period 2011–12 to 2020–21 were used to examine characteristics and service use patterns of older clients (the older cohort) compared with the comparison cohort (the non-older cohort) (Figure Older.1).

The retrospective study period for this cohort is the 36 months before the start of the defining study period (which is the 36 months from the start of their first support period in which each client was aged 55 or over in July 2014 to June 2017). The prospective study period is the 36 months after the end of each client’s 36 month defining study period.

Figure Older.1: Older cohort 2014–17, longitudinal analysis overview

Key characteristics of the older cohort 2014–17

There were 44,300 clients in the older 2014–17 cohort; these clients had the following key characteristics (Figure Older.2, Table Older1417.1, Table Older1417.2):

  • Two-thirds of older clients (66% or 29,300) were aged 55 to 64 years at the time of at least one of their support periods in 2014–17; the remaining 15,000 clients were 65 years or over.
  • Over 57% were female (25,100 clients).
  • Over half of clients (57%; 25,300 clients) had only one support period during the defining study period and 23% (10,200) had 3 or more support periods.
  • A large proportion (91%) presented for support alone.
  • Almost half (46%; 20,500 clients) sought support due to financial difficulties.
  • Almost 40% (17,300 clients) were known to have experienced homelessness at least once during their SHS support in 2014–17; most of these clients (10,000) were male.
  • Around 5,400 clients (12%) were Indigenous and 11,800 clients (27%) were overseas born.
  • Around 19% had used SHS services previously; that is, 8,500 clients had received support in the 36-month retrospective period that preceded the defining study period.
  • Around 13% of clients (6,000) continued to receive support into the future; that is, they received support in the 36 months after the defining study period.

Figure Older.2: Older and non-older cohorts 2014–17, client key characteristics, by study period

Service engagement profiles

SHS support patterns of the older cohort over the entire longitudinal period (2011–21) were examined. Almost three-quarters (32,300 or 73%) of the older cohort were short-term clients (receiving services only during the 36-month defining study period) (Figure Older.3, Table Older1417.1, Table Older1417.2). The support patterns of older clients can also be broken down by sex; 71% (13,600) of older male clients only received support in the defining period (short-term), compared with 75% (18,800) of older female clients.

Figure Older.3: Older cohort 2014–17, service engagement profiles

Vulnerability pathways

Using data for the entire longitudinal period, client profiles were examined for the presence of vulnerabilities including mental health issues, drug and/or alcohol problems, and experience of family and domestic violence (FDV) within each of the 3 study periods – the retrospective, defining and prospective periods (Figure Older.4, Table Older1417.1, Table Older1417.3). For more information on the derivation of these vulnerabilities, see Methodology.

Almost one-third (29%) of older clients (12,800) had mental health issues in the defining period. Of these, 8,300 (65% of clients with mental health issues in the defining period) were not SHS clients in both the retrospective and prospective periods. Only 3% (410 clients) had mental health issues in all study periods. Around 9% (1,100 clients) had mental health issues in both the retrospective and defining periods and were not clients in the prospective period.

Figure Older.4 shows vulnerability pathways for older clients experiencing FDV, clients with a mental health issue and those with problems with drugs or alcohol.

Figure Older.4: Older cohort 2014–17, vulnerability pathways

SHS services needed by older cohort clients

The need for, and provision/referral of, SHS services was examined for the older cohort clients in the retrospective, defining and prospective study periods; aggregation is based on services needed or provided/referred in support periods that commenced within each study period only.

Patterns of service need were generally similar for the older cohort clients across the 3 study periods (Figure Older.5, Table Older1417.1, Table Older1417.4). For example, the proportion of clients with a need for accommodation assistance (any form) ranged from 66% in the defining and prospective study periods to 68% in the retrospective period, noting that only a small proportion of older clients were long-term clients. One in 4 (25% or 11,000) older clients needed financial information in the defining period, with 90% receiving this service.

Figure Older.5: Older cohort 2014–17, select top 10 services and assistance needed and service provision status by study period

How the older cohort compares with a non-older cohort

In 2014–17, compared with the non-older cohort, older clients were (Figure Older.2, Table Older1417.1):

  • less likely to be Indigenous (12% compared with 21% in the non-older cohort) and more likely to be overseas born (27% compared with 17%)
  • less likely to have had vulnerabilities such as mental health issues (29% compared with 38%), drug or alcohol problems (7% compared with 15%) or have experienced FDV (26% compared with 42%) in the defining period
  • less likely in the defining period to have needed short-term or emergency accommodation (28% compared with 45%), have received any accommodation (19% compared with 32%), or been homeless (39% compared with 55%)
  • more likely in the defining period to ever present alone (91% compared with 86%) and present to an agency due to medical issues (22% compared with 12%).

How did service needs differ?

Differences in identified service need between older and non-older clients were examined using relative risk, calculated by dividing the risk of an event occurring for one group (specifically, service need for each service type separately for older clients) by the risk of an event occurring for another group (service need for non-older clients).

Older clients were less likely to require services overall, when compared to clients aged 54 and under. There were only two services that were more common among older clients (Figure Older.6; Table Older1417.5):

  • Older clients were twice as likely (relative risk (RR) 2.00) to need physical disability services, and
  • 65% more likely (RR 1.65) to require interpreter services.

This accords with the characteristics of older clients compared with non-older clients – they have relatively fewer vulnerabilities and are less prone to homelessness and may instead be accessing SHS to address needs relating to ageing or a decrease in social capital due to ageing. The need for interpreter services highlights the fact that many older clients of SHS services were overseas born (27% compared with 17% of non-older clients) (Table Older1417.1).

Figure Older.6: Relative risk of needing a SHS service type, older and non-older clients, by study period, 2014–17

Factors associated with SHS service use

Descriptive regression models were used to examine whether client characteristics or support experience in the defining period were associated with receipt of SHS support in the prospective study period (ongoing service use). Information on interpreting regression models can be found in the section Understanding factors associated with past and future support. Two models were created; a ‘client characteristic’ model (Model 1) that contained client characteristics and a ‘reasons’ model (Model 2) that supplemented these characteristics with flags for the 26 possible reasons why the client sought support during the defining study period.

Variations in state and territory specific policies and service delivery models mean that the likelihood of a client receiving services in the future varies among states and territories. Therefore, in addition to a national model, separate regression models were created for each state or territory where there was sufficient sample size (at least 3,500 clients; Figure Older.7). The models are descriptive, that is, they are intended to describe the client variables that are associated with past or future service use without proposing or testing specific causal pathways.

The outcome variable (receipt of SHS support) was a binary measure (yes or no) and did not distinguish between clients that needed SHS services only once in the prospective study period and clients that required frequent support.

Risk ratios were created to measure the association between the use of SHS services and a set of client characteristics (see Glossary entry on Relative risk for how to interpret the results)

Some bias is present in this outcome measure because some clients who required services in the future may not have been able to receive them (see the section on Bias within the SHSC longitudinal data).

The results from the client characteristic model (Model 1) demonstrate that although different in magnitude in each state or territory, being an Indigenous Australian (80% greater likelihood in the national data) had the greatest association with future SHS support (Figure Older.7). As mentioned in the introduction, this may be in part due to the social and economic disadvantages faced by Indigenous Australians (POA 2004, AIHW 2020). Conversely, owning a home at some time in the defining study period was associated with a reduced likelihood of ongoing SHS use (28% reduction).

The reasons model (Model 2) demonstrates that having financial difficulties as a reason for seeking assistance was associated with an increased likelihood of ongoing SHS support (70% greater likelihood in the national data). Nationally, clients whose reason was transition from custodial arrangements were 46% more likely to receive SHS support into the future.

Figure Older.7: Relative risk for use of SHS services (older cohort 2014–17)

Summary

There were over 44,300 older clients (aged 55 and over) that used SHS in 2014–17. Compared with younger clients, these clients were more likely to be foreign-born and need support for physical disability or need interpreter services. They tended to be less likely to have vulnerabilities such as experience with FDV, mental health issues, or problems with drugs or alcohol. They were also less likely to require accommodation support, with the main services needed being advice, advocacy, or other basic assistance.

Associations with greater likelihood of future SHS use include being Indigenous, having financial difficulties as a reason for seeking assistance and transition from custodial arrangements as a reason for seeking assistance. Conversely owning a home reduced the likelihood of ongoing SHS use.

Data tables