Entries, exits and transfers
On this page
Quick facts
- During 2018–19, 42,300 households were newly allocated to public housing, community housing and SOMIH housing dwellings.
- There was a 15% increase in the number of households that exited public housing between 2017–18 and 2018–19, from 26,400 to 30,200.
- During 2018–19, 3% of public housing households and 2% of SOMIH households transferred—or were relocated—to a different dwelling within the same housing program.
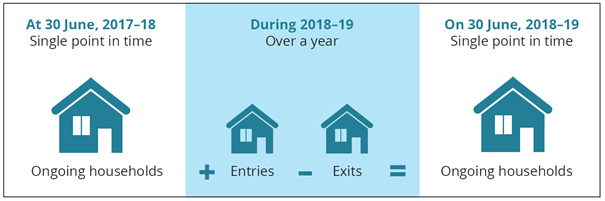
Over time, people may be allocated social housing, exit a social housing program, or move from one social housing dwelling to another within the same program (Figure 1). This section presents key data about these entries, exits and transfers. Further detailed analysis of newly allocated social housing for priority groups (special needs and greatest need) and time spent on the waiting list are presented in subsequent sections.
Data on newly allocated households for Indigenous community housing were not available.
Figure 1: Entries, exits and ongoing households
Households entering social housing
Entry into social housing is dependent upon eligibility, with priority needs having an influence on the pathway of people into social housing. Generally, as dwellings become available they are offered to priority applicants, then other waiting list applicants whose eligibility and location requirements match the dwelling (Powell et al. 2019).
In 2018–19, there were 42,300 newly allocated households across public housing, community housing and SOMIH programs. Around half of these were new allocations to community housing (21,300 households), with 19,700 allocated to public housing and 1,400 to SOMIH (Supplementary table HOUSEHOLDS.10).
The number of new entries to public housing has remained relatively stable since 2011–12, at around 20,000 to 21,000 newly allocated households each year (Figure 2; Supplementary table HOUSEHOLDS.19).
Figure ENTRIES, ONGOING AND EXITS.2: Ongoing, newly allocated and exited households, by public housing and SOMIH, at 2011–12 to 2018–19. This vertical bar graph shows that ongoing households make up the highest number of households for both public housing and SOMIH. The number of ongoing public housing households decreased from 323,400 in 2011–12 to 294,100 in 2018–19. The trend for SOMIH differed where the number of ongoing households remained stable from 2011–12 (9,700) to 2017–18 (9,200) but increased in 2018–19 (13,900). In 2018–19, the highest number of public housing households were ongoing at around 294,100, compared with 30,200 households that exited and 19,700 households that were newly allocated. Similarly for SOMIH the highest number of households were ongoing (13,900), compared with 1,300 households that exited and 1,400 that were newly allocated, in 2018–19.

Figure TRANSFERS AND EXITS.3: Households by transfer and exit status, by public housing and SOMIH and states and territories, 2011–12 to 2018–19. This vertical bar graph shows nationally the number of public housing and SOMIH households that exited were higher than those that transferred, from 2011–12 to 2018–19. In 2011–12, 22,900 public housing households exited and 8,200 households transferred; in 2018–19, 30,200 households exited and 9,000 transferred. In 2011–12, around 650 SOMIH households exited and 300 transferred; in 2018–19, 1,300 households exited and around 300 transferred.
