Occupants and households
On this page
Quick facts
- In 2018–19, there were around 797,100 occupants in Australia’s 3 main social housing programs (public housing, state owned and managed Indigenous housing (SOMIH) and community housing).
- The majority (72%) of social housing occupants were in public housing.
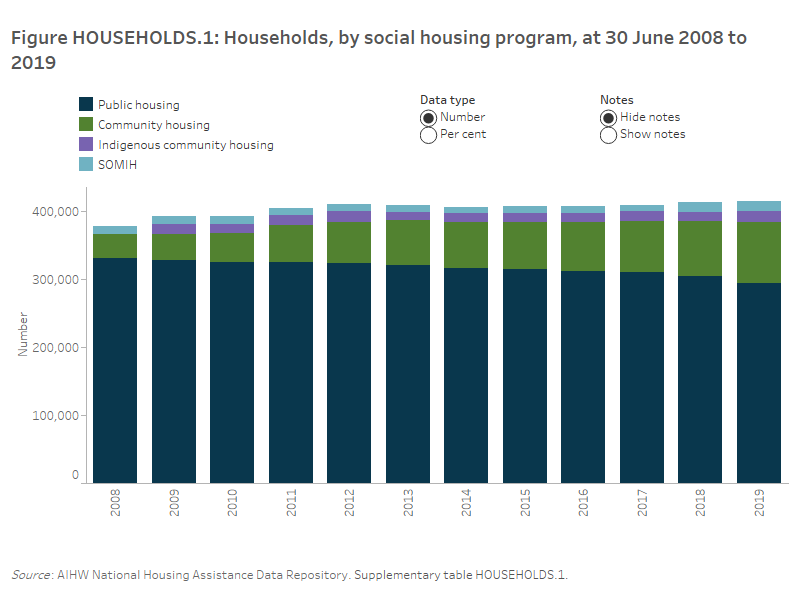
- At 30 June 2019, there were 415,100 households in the main social housing programs in Australia, increasing from 378,600 at 30 June 2008.
- The number of households in community housing has more than doubled (up 157%) from around 35,000 in 2008 to 90,000 in 2019; some of this growth is related to the transfer of public housing dwellings to community housing.
- Over 4 in 10 (43%) households in public housing had been in their tenancies for 10 years or more.
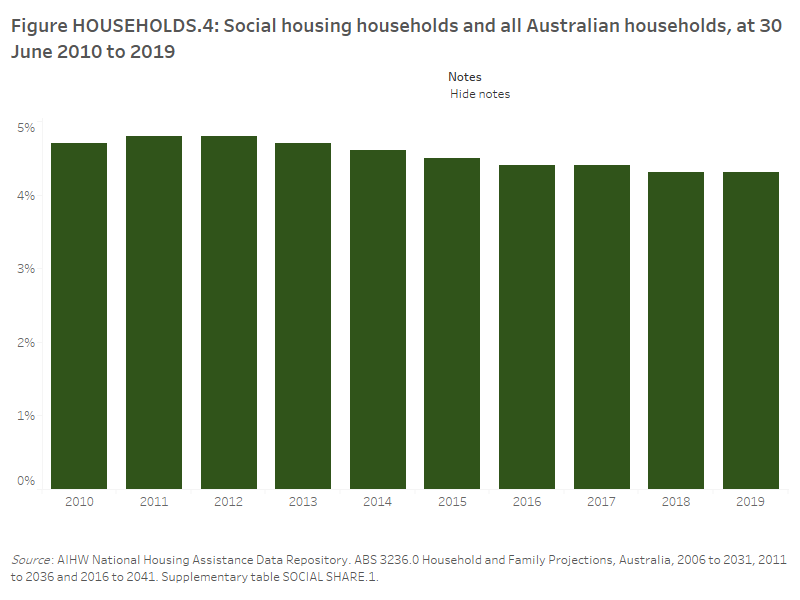
- The proportion of households living in social housing in Australia decreased from 4.7% in 2010 to 4.3% in 2019.
Occupants in social housing
The term ‘Occupants’ refers to all those living in social housing programs (sometimes also referred to as tenants). The following presents data on people living in public housing, SOMIH and community housing; data for Indigenous community housing were not available.
In 2018–19, there were around 797,100 people living in Australia’s 3 main social housing programs: public housing, state owned and managed Indigenous housing (SOMIH) and community housing (complete data were not available for all programs in Queensland and the Northern Territory).
Of the social housing occupants in 2018–19:
- 72% were in public housing (around 576,400 people)
- 21% were in community housing (around 170,100 people)
- 6% were in SOMIH (around 50,600 people) (Supplementary table OCCUPANTS.1).
The number of occupants living in social housing in Australia increased between 2014 and 2016 from 805,000 to 820,400 after which it declined to 797,100 in 2019.
The location of social housing occupants across the states and territories has been relatively consistent over time, with 33% living in New South Wales, 19% in Victoria and 17% in Queensland. Considering the individual social housing programs, there have been some notable changes over time. The proportion of occupants in community housing living in Victoria has decreased from 24% to 15% from 2014 to 2019. Western Australia has had a similar decline in occupants living in community housing, from 12% to 8% over this period.
Age and sex of occupants
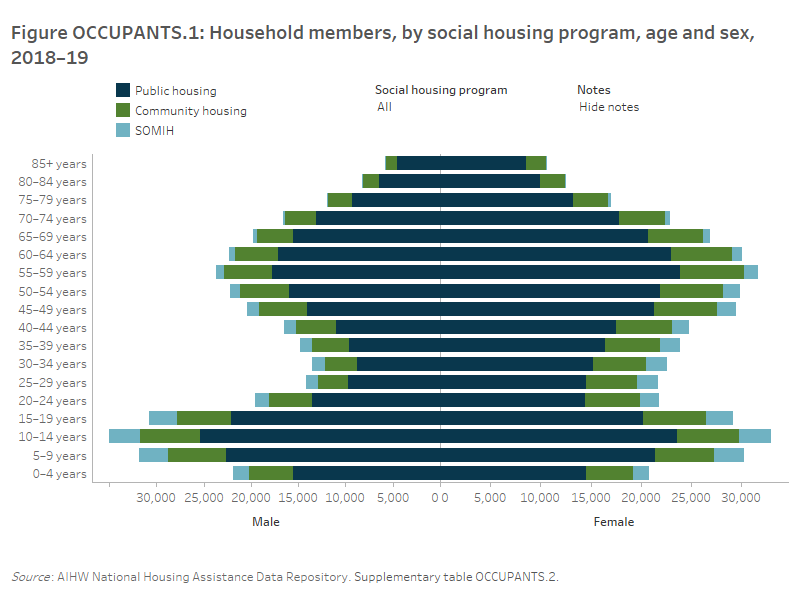
Females continued to make up the majority of all occupants across the 3 main social housing programs. In 2018–2019, there were 318,800 females (56%) in public housing, 27,900 (55%) in SOMIH and 93,300 (56%) in community housing.
Key differences in the age profile of public and community housing include:
- The public housing program had an older age profile than community housing, with 35% of occupants aged 55 years and over compared with 31%, respectively.
- A larger proportion of public housing occupants (22%) were children aged under 15 years compared with community housing (20%).
- Across the other age groups, community housing had a higher proportion of occupants (48%) aged 15–54 compared with public housing (43%).
The SOMIH program had a different age profile from the other two programs, with half of occupants (49%) aged under 25 and around a third (32%) of all SOMIH household members were aged 0–14. There were 32% of SOMIH occupants aged 25–49 years and 19% aged over 50 (Figure OCCUPANTS.1).
Figure OCCUPANTS.1: Household members, by social housing program, age and sex, 2018–19. The butterfly graph shows the age profile of male and female household members in three social housing programs (public housing, community housing and SOMIH). In 2018–19, the highest number of female household members in public housing were aged 55–59 years of age (24,000) whereas the highest number of male household members were aged 10–14 years (25,300). For SOMIH, the highest number of female (3,200) and male (3,400) household members were aged 10–14 years.
Occupant satisfaction
Results from the 2018 National Social Housing Survey (NSHS) show that occupant satisfaction with services from their housing provider is closely associated with the condition of their home, with satisfaction falling significantly as the number of structural problems increased (AIHW 2019b). This relationship holds after accounting for a wide range of geographic, demographic and housing-related factors. There were also significant relationships between occupant satisfaction and the number of working facilities in the home, time spent living in social housing, household composition, housing program and geographic variables such as state or territory.
The 2018 NSHS results also showed that 3 in 4 (75%) social housing occupants Australia-wide were satisfied with the services provided by their housing organisation. This high overall level of satisfaction has not changed since 2014 (73%). Public and community housing occupants’ satisfaction has remained stable since 2014, while the satisfaction of SOMIH occupants has increased. Community housing occupants (80%) were more satisfied than public housing occupants (74%) or SOMIH occupants (66%) with the services offered by their housing providers in 2018.
Further information about occupant satisfaction with amenities, locations and services as well as the economic, health and social benefits of social housing, is published in the National Social Housing Survey 2018 (AIHW 2019b).
Households in social housing
At 30 June 2019, there were around 415,100 ongoing households living in the 4 main social housing programs across Australia. In these main social housing programs:
- 294,100 households (71%) were in public housing
- 90,000 households (22%) were in community housing
- 13,900 households (3%), were in SOMIH (Figure HOUSEHOLDS.1, Supplementary table HOUSEHOLDS.1).
Figure HOUSEHOLDS.1: Households, by social housing program, at 30 June 2008 to 2019. This vertical stacked bar graph shows the highest proportion of households from 2008 (88%) to 2019 (71%) were in public housing. SOMIH had the lowest proportion of households from 2008 (3.3%) to 2019 (3.4%). In 2019, community housing had the second highest proportion of households at 22% followed by Indigenous community housing (4.1%).
Households
Information about households is presented here for the 3 main programs: public housing, state owned and managed Indigenous housing (SOMIH) and community housing. Complete data were not available for all programs in Queensland and the Northern Territory. Indigenous community housing is out of scope for this section due to incomplete data for some states and territories.
For the purposes of this analysis, a household is either an individual or a group of 2 or more related or unrelated people residing in the same dwelling. Information is presented about ongoing households, that is, those with a tenancy that has not concluded by 30 June in the reference year.
In 2017, some information was reported about 5,000 dwellings who transferred from public housing to SOMIH. From 2018, households and tenants information was reported for these dwellings.
Changes over time
Overall, the number of ongoing households in the three main social housing programs has been fairly stable in recent years (between 380,000 and 400,000 since 2008) (Supplementary table HOUSEHOLDS.1). The number of households in each of the programs, however, have changed somewhat in this time. This likely reflects the policy focus towards growing the community housing sector and transferring ownership and/or management of public housing stock to community housing organisations.
The number of public housing households decreased from 331,100 in 2008 to 294,100 in 2019, offset by an increase in community housing households (from 35,000 to 90,000 over the same period).
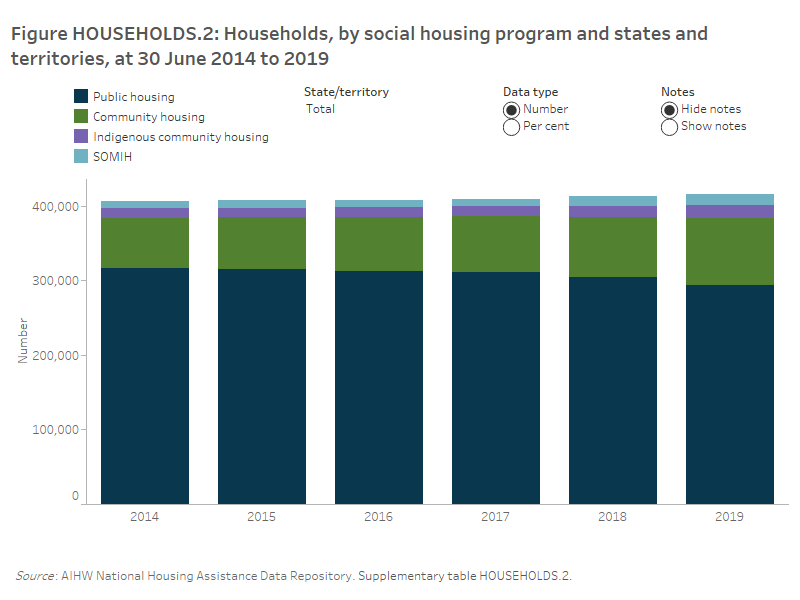
The number of SOMIH households decreased from 12,400 in 2008 to 9,600 households in 2017. In 2018, when SOMIH household data for the Northern Territory were reported for the first time, the number of SOMIH households increased to 13,800 (Supplementary table HOUSEHOLDS.2). The number of households was similar in 2019 at 13,900 households (Figure HOUSEHOLDS.2).
Location of households
The states and territories have different models of social housing provision. At 30 June 2019:
- The vast majority of households in the Australian Capital Territory were in public housing (93%), with 7% community housing.
- In contrast, 67% of social housing households in New South Wales were in public housing with 28% in community housing. The proportion in community housing in New South Wales has steadily increased from 18% in 2014.
- Tasmania had a more even split between public housing (51%) and community housing (47%), and this has been the case since 2015. Tasmania was also one of five states and territories to provide SOMIH, with most ranging from 2 to 5%.
- For the Northern Territory, of those in social housing, around 40% of households were in SOMIH and public housing alike, with 4% in community housing and 17% in Indigenous community housing (Figure HOUSEHOLDS.2, Supplementary table HOUSEHOLDS.2).
Figure HOUSEHOLDS.2: Households, by social housing program and states and territories, at 30 June 2014 to 2019. Nationally, this vertical stacked bar graph shows that public housing had the highest number and proportion of households, from 2014 (317,000 or 78%) to 2019 (294,100 or 71%). The Australian Capital Territory had the highest proportion of public housing from 2014 (95%) to 2019 (93%). Tasmania had the highest proportion of community housing from 2014 (35%) to 2019 (47%). In 2019, of those states and territories that had a SOMIH program, the Northern Territory (40%), had the highest proportion of SOMIH households whereas Tasmania (1.6%) had the lowest proportion of SOMIH households.
At 30 June 2019, across remoteness areas, most (71%) social housing households were located in Major cities, followed by 16% in Inner regional areas, 9% in Outer regional areas, 2% in Remote areas and 2% in Very remote areas (Supplementary table HOUSEHOLDS.3). The majority of public housing households (75%) and community housing households (66%) were in Major cities, while the highest proportion of SOMIH households were in Remote and Very remote areas (41% combined).
Key characteristics of households
Key characteristics of ongoing social housing households at 30 June 19 were:
- almost two-thirds (62%) of main tenants were female with 37% male
- main tenants aged 55–59 were the largest 5 year age group (11%, or 44,300 households)
- around 54,600 (14%) main tenants were aged 75 or older
- over 1 in 10 (14%, or 54,300) included an Indigenous member
- almost 2 in 5 (37%, or 146,100) included a tenant with disability
- most households comprised single adults (56%, or 222,800) (Supplementary table HOUSEHOLDS.3).
The vast majority of ongoing households were low income households (98%) (Supplementary table HOUSEHOLDS.7). There was some variation between the 3 main programs, with 99% of public housing, 98% of SOMIH and 95% of community housing being low income households in 2019.
Length of household tenure
Stability of tenure can provide a foundation for social housing members to improve their economic participation, settle into and engage with the community, and support their health (Stone et al. 2015, SCRGSP 2019). For people in a precarious employment situation, the knowledge that they have somewhere to live should they be unable to keep their job provides some peace of mind (Wiesel et al. 2014).
A substantial proportion of households in public housing and SOMIH remain in tenure for long periods of time. At 30 June 2019:
- 43% of public housing and 25% of SOMIH households had been in the same tenure for more than a decade. Around 1 in 5 tenancies had been in place for less than a year (18% for public housing and 22% for SOMIH).
- By contrast, 15% of community housing households had been in the same tenure for more than a decade and almost 4 in 10 (37%) had been in place for less than a year (Supplementary table HOUSEHOLDS.6). This may be related to the length of time community housing dwellings have been available and the large transfer of public housing stock to community housing in 2019 (Figure HOUSEHOLDS.3).
Over time, the proportion of ongoing households with long-term tenure has increased. For public housing, there has been an increase in the proportion of households with a tenure length of 20–29 years, rising from 9% in 2011 to 13% in 2019; similarly for a tenure length of 30 years or more there has been an increase from 3% to 5% over the same period (Figure HOUSEHOLDS.3, Supplementary table HOUSEHOLDS.6).
Figure HOUSEHOLDS.3: Households, by tenure length, age group and social housing program, at 30 June 2019. This waterfall graph shows, across the social housing programs (public housing, community housing and SOMIH) the most common tenure for all age groups was 10–19 years (87,600). In community housing, the most common tenure length of those aged 15–24 years (2,000) was over 6 months to 1 year. Of those aged 45–54 (4,600) and 65+ (7,600), the most common tenure length was 5–9 years. The most common tenure length for all age groups for SOMIH (4,400) was 5–9 years; compared with public housing (74,900) where the most common tenure length was 10–19 years.
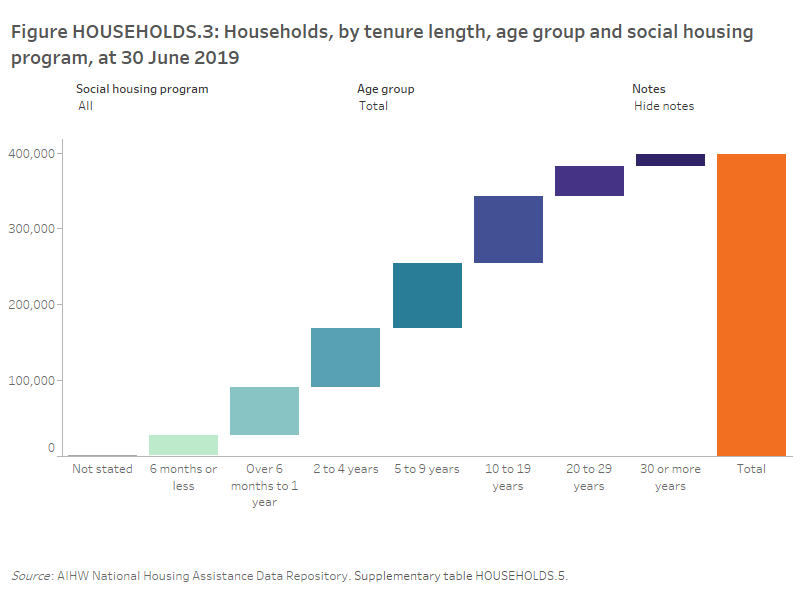
The length of tenancy also differs considerably by the age of the main tenant in the household. For public housing, shorter tenancy lengths (up to 1 year) were more evenly distribution across all age groups. In contrast, tenancies between 2–4 years in length were more commonly reported for older tenants (with 23% of clients aged 65+ years), with the longest tenancies predominantly for older tenants (76% of clients in tenancies for 30 or more years were 65+ years) (Supplementary table HOUSEHOLDS.5).
Supply of social housing
There are various ways to look at the level of social housing in Australia. Considering the social dwelling stock in relation to overall dwelling stock is one way, however, using household counts is a suitable alternative.
In this report, the number of households in social housing comprises public housing, SOMIH, community housing and Indigenous community housing, sourced from the National Housing Assistance Data Repository. The total households in Australia is sourced from the Australian Bureau of Statistics household projections series (ABS 2010; ABS 2015; ABS 2019).
Note: Improvements were made to the methodology for calculating social share between HAA 2018 (AIHW 2019a) to 2019.
In recent years, the number of social housing households has increased from 393,500 in 2010, to 415,100 at 30 June 2019. Note that this includes all social housing households for public housing, SOMIH, community housing and Indigenous community housing. The number of total households in Australia over the same period increased from 8.4 million in 2010 to 9.6 million households in 2019 (ABS 2010; ABS 2019).
While the number of households in social housing has generally increased over time, it has not kept pace with the growth in the overall number of households in Australia. The proportion of social housing households has declined from 4.7% in 2010 to 4.3% in 2019 (Figure HOUSEHOLDS.4; Supplementary table SOCIAL SHARE.1).
Figure HOUSEHOLDS.4: Social housing households and all Australian households, at 30 June 2010 to 2019. This vertical bar graph shows that the proportion of social housing households remained stable over time, starting at 4.7% in 2010 and decreasing from a high of 4.8% in 2012 to 4.3% in 2019.
International comparison
Australia’s level of social housing can be contrasted with levels of OECD and European Union countries. In 2017, Australia (4%) had a similar level of social housing compared with Canada (4%), Japan (3%) and Germany (3%). Australia’s level was higher than Estonia (1%), but lower than the Netherlands (38%) and Denmark (21%) (OECD 2019). For further information, see Housing Data Dashboard.
- ABS (Australian Bureau of Statistics) 2010. Household and Family Projections, Australia, 2006 to 2031. Cat. no. 3236.0. Canberra: ABS.
- ABS 2015. Household and Family Projections, Australia, 2011 to 2036. Cat. no. 3236.0. Canberra: ABS.
- ABS 2019. Household and Family Projections, Australia, 2016 to 2041. Cat. no. 3236.0. Canberra: ABS.
- AIHW (Australian Institute of Health and Welfare) 2019a. Housing Assistance in Australia 2019. Cat. no. 315. Canberra: AIHW.
- AIHW 2019b. National Social Housing Survey 2018. Cat. no. HOU 311. Canberra: AIHW.
- AIHW 2020. Housing data dashboard. Viewed 23 March 2020.
- OECD (Organisation of Economic Cooperation and Development) 2019. Affordable Housing database. Latest year available at 17 December 2019.
- SCRGSP (Steering Committee for the Review of Government Service Provision) 2019. Report on Government Services 2018 – Housing (Part G, Chapter 18). Viewed 10 March 2020.
- Stone W, Sharam A, Wiesel I, Ralston L, Markkanen S and James A 2015. Accessing and sustaining private rental tenancies: critical life events, housing shocks and insurances. AHURI Final Report No.259. Melbourne: Australian Housing and Urban Research Institute.
- Wiesel I, Pawson H, Stone W, Herath S and McNelis S 2014. Social housing exits: incidence, motivations and consequences. AHURI Final Report No.229. Melbourne: Australian Housing and Urban Research Institute.


