Suitability of dwelling size
On this page
Quick facts
- At 30 June 2019:
- the majority (80%) of social housing households were considered to be residing in dwellings adequate to their household composition.
- 4% of public housing, 25% of state owned and managed Indigenous housing (SOMIH) and 4% of community housing households were considered to be in overcrowded dwellings.
- Overcrowding continues to be most common in very remote areas for public housing and SOMIH (8% and 50% of very remote areas, respectively).
- The number of overcrowded public housing dwellings has dropped from 14,500 (5%) in 2014 to 10,900 (4%) in 2019.
- At 30 June 2019, 17% of public housing and 26% of SOMIH housing households were considered to be in underutilised dwellings.
Ensuring the best fit between a social housing dwelling and household requirements is not a straightforward process. It is influenced by the availability of dwellings and dwelling configuration, as well as the age, condition and location of the property. This is in addition to the availability of options and specific household requirements (such as disability modifications), and the cost to relocate existing tenants, as well as their willingness to relocate.
The Canadian National Occupancy Standard, commonly referred to as CNOS, is a generally accepted standard by which the dwelling size requirements of a given household are measured in Australia, however, is not necessarily used by all states/territories in the operation of social housing programs.
Canadian National Occupancy Standard (CNOS)
A measure of the appropriateness of housing that is sensitive to both household size and composition, the CNOS specifies that:
- no more than 2 people shall share a bedroom
- parents or couples may share a bedroom
- children under 5 years, either of the same sex or opposite sex, may share a bedroom
- children under 18 years of the same sex may share a bedroom
- a child aged 5–17 should not share a bedroom with a child under 5 of the opposite sex
- single adults 18 years and over, and any unpaired children require a separate bedroom.
Source: CMHC 2014
For more information on the CNOS, see AIHW Metadata Online Registry (METeOR).
Whilst the CNOS is a useful guide to estimate the proportion of dwellings that may be underutilised or overcrowded, there are some cases where a dwelling may not match a household size for good reason. For example, where custody of children is shared; where tenants may have live-in care arrangements; or to take into consideration future needs of children who may need separate bedrooms in years to come.
CNOS also does not take into consideration cultural norms, with some studies suggesting that the approach is particularly problematic for Aboriginal and Torres Strait households (Memmott et al 2003, Memmott et al 2011, Pholeros 2010). Regardless of the appropriateness of the measure, overcrowding based on CNOS has been found to adversely affect the physical and mental health of residents (AIHW 2014, Booth & Carroll 2005, SCRGSP 2016).
Housing suitability
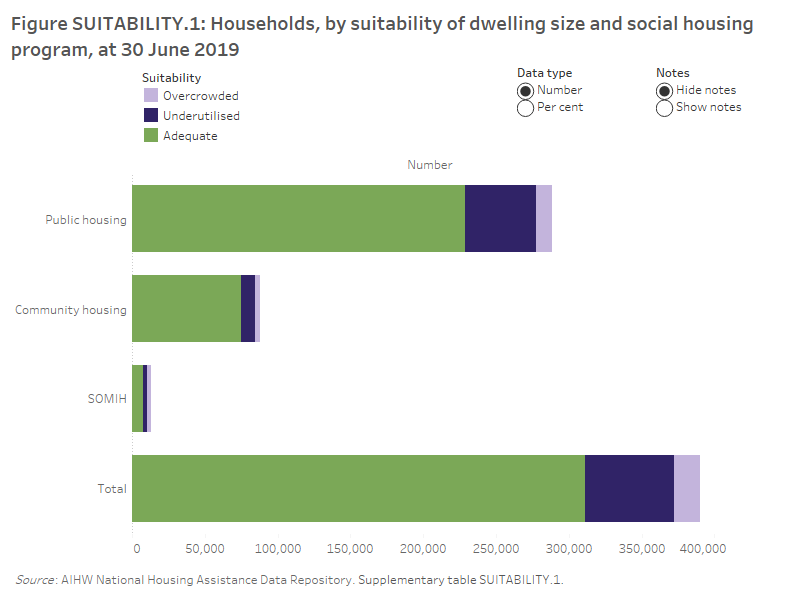
At 30 June 2019, the vast majority of social housing households were living in dwellings that were adequate. There were more social housing households living in underutilised dwellings (61,300 or 16%) than in overcrowded dwellings (17,500 or 5%) (Figure SUITABILITY.1).
Figure SUITABILITY.1: Households, by suitability of dwelling size and social housing program, at 30 June 2019. This horizontal stacked bar graph shows the vast majority of social housing households were living in dwellings that were adequate (80%); there were more social housing households living in underutilised dwellings (16%) than in overcrowded dwellings (5%), in 2019. The majority of households in the public housing (79%) and community housing (85%) were considered to be residing in dwellings adequate to their household composition; compared with SOMIH where 49% of households were considered to be in residing in dwellings that were adequate. SOMIH had the highest proportion of underutilised dwellings (26%) and overcrowded dwellings (25%).

Overcrowding
In basic terms, overcrowding occurs when the dwelling is too small for the size and composition of the household living in it. In Australia, a dwelling requiring at least 1 additional bedroom is designated as overcrowded, as defined by the CNOS standard described above.
At 30 June 2019, 10,900 (4%) public housing and 3,200 (4%) community housing households were in overcrowded dwellings. One in 4 SOMIH households were in overcrowded dwellings (25%, or 3,400 households).
Overcrowding data for Indigenous community housing were not available.
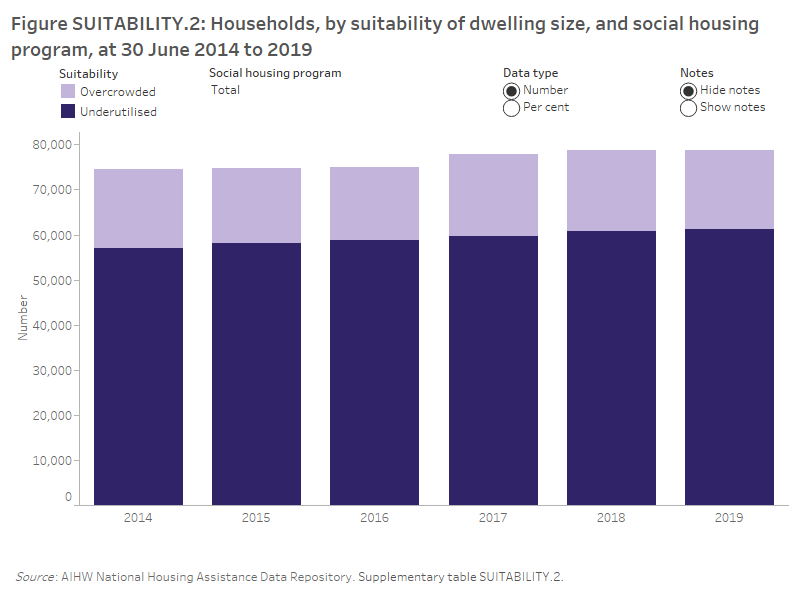
While there has been little change in the proportion of overcrowded dwellings in the three main social housing programs from 2014 to 2019, the numbers have varied (Figure SUITABILITY.2). Some of this change can be attributed to reporting and data availability and, therefore, data may not be directly comparable over time (see the notes in the figure).
Figure SUITABILITY.2: Households, by suitability of dwelling size, and social housing program, at 30 June 2014 to 2019. This vertical stacked bar graph shows across the social housing programs (public housing, community housing and SOMIH), there were more households in underutilised than overcrowded dwellings, from 2014 to 2019. Across the social housing programs, the proportion of underutilised dwellings remained stable with 15% in 2014 and 16% underutilised in 2019. Across the social housing programs, the proportion of overcrowded dwellings also remained stable, from 4.7% in 2014 to 4.5% in 2019. The proportion of overcrowded households in public housing remained stable at around 4–5% between 2014 and 2019. Overcrowding in community housing remained at around 4% over the same years. The proportion of overcrowded households in SOMIH increased from 10% in 2014 to 25% in 2019.

The proportion of overcrowded households in public housing has remained stable at around 4–5% between 2014 and 2019. Overcrowding in community housing has remained at around 4% over the same time period, during a period of considerable growth in overall stock levels (Supplementary table SUITABILITY.2). See Social housing dwellings section for further information.
Nationally, the proportion of overcrowded households in SOMIH decreased from 10% in 2014 to 9% in 2016. The addition of over 5,000 remote public housing dwellings in the Northern Territory to the SOMIH data collection from 2017 increased the overcrowding counts and proportions (Supplementary table DWELLINGS.2). This is reflected in the most recent data which show that overcrowding levels for SOMIH in Australia have been stable for the last three reporting periods, at around one-quarter (24–25%) of SOMIH households.
Location
The proportion of households in overcrowded dwellings varied across social housing programs, states and territories and remoteness areas. At 30 June 2019:
- In the Northern Territory, 7% of public housing households were living in overcrowded dwellings, as were 5% of those in the Australian Capital Territory.
- The number of overcrowded households in public housing dwellings in NSW decreased from 5,100 to 3,300 over the years 2014 to 2019.
- Over half of SOMIH households in the Northern Territory experienced overcrowding (54%), down from 56% in 2017.
- For community housing, 4% of households in New South Wales were experiencing overcrowding, down from 6% in 2014 (Supplementary table SUITABILITY.3).
Overcrowding in Indigenous households
Generally, the CNOS model is a useful tool for assessing overcrowding and it allows comparison between different population groups using the same standard. However, as noted earlier, this method may not be appropriate for measuring overcrowding within the Indigenous context. The measure may not reflect the specific cultural and behavioural factors that influence household size such as a strong connection to family and a culture of sharing accommodation. It may also not reflect that Indigenous household sizes can fluctuate due to temporary or semi-permanent visitors (Aboriginal and Torres Strait Islander people: a focus report on housing and homelessness) (AIHW 2019).
At 30 June 2019, there were 2,600 overcrowded Indigenous households living in public housing, representing almost 1 in 12 (8%) total Indigenous public housing households (Supplementary table SUITABILITY.4). From 2014 to 2018, there was a decline in the proportion of overcrowded Indigenous households in public housing (from 10% to 8%); with 200 fewer Indigenous households in overcrowded housing. This decrease was over a time when the number of Indigenous households in public housing increased by 4,200, from 28,700 to 32,800 respectively.
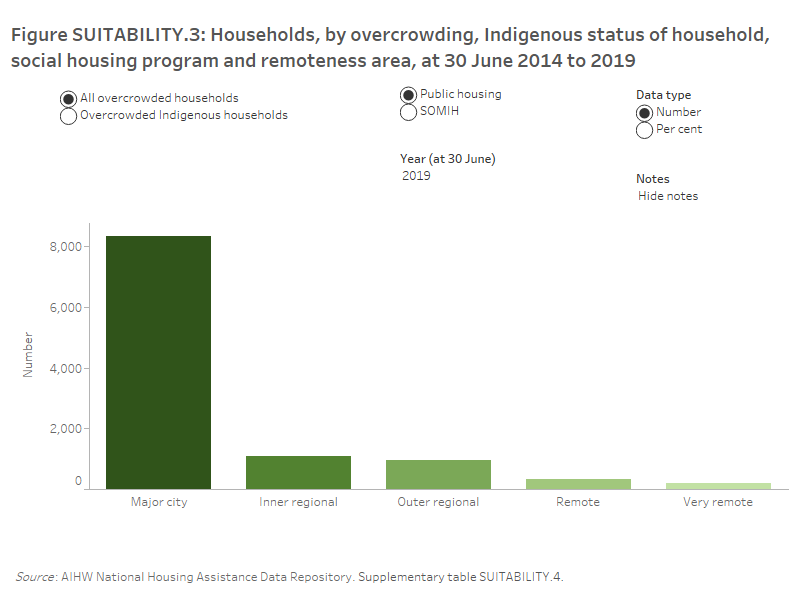
There has been little change in the distribution of overcrowded Indigenous public housing households across remoteness areas. Similar to previous years, at 30 June 2019 Indigenous households in public housing dwellings in Very remote (10%) and Remote areas (10%) were more likely be in overcrowded housing compared with Major cities (8%) (Figure SUITABILITY.3).
At 30 June 2019, 1 in 4 Indigenous SOMIH households were living in overcrowded conditions (25%, or 3,400). The proportion of overcrowded SOMIH Indigenous households generally increased with increasing remoteness. Half of households in Very remote (50%) and 31% of those in Remote areas were living in overcrowded conditions, compared with 8% of those living in Major cities. This is consistent with 2018, when remoteness area data for SOMIH included the Northern Territory for the first time (for further information, please see Data quality statements).
Figure SUITABILITY.3: Households by overcrowding, Indigenous status of household, social housing program and remoteness area, at 30 June 2014 to 2019. This vertical bar graph shows, across the public housing and SOMIH programs, a higher proportion of both Indigenous and all overcrowded households live in Very remote areas. In 2019, the highest proportion of all overcrowded households in public housing, resided in Very remote areas (8.3%) followed by Remote areas (6.7%). Similarly, overcrowded Indigenous households in public housing, were most likely to be found in Very remote (10.4%) and Remote (9.9%) areas, in 2019.

Underutilisation
A dwelling is said to be underutilised when it consists of 2 or more bedrooms surplus to the household requirements, as determined by the CNOS measure.
Underutilisation can arise as a household ages and children leave the family home. Interpretation of underutilisation data needs to consider the circumstances of tenants. For example, tenants may have been living in a home for a number of years and their economic, social and community life is centred around that location. There may be no suitable location based alternatives when household composition changes. Underutilisation may also occur due to the housing stock being dominated by family-sized homes with 3 or more bedrooms (see Social housing dwellings) which may not be consistent with the overall social housing household composition profile (such as single adult households, see Occupants and households).
At 30 June 2019, 17% of public housing and 11% of community housing households were in underutilised dwellings (Figure SUITABILITY.1, Supplementary table SUITABILITY.1). Social housing targeted towards Indigenous households had the highest proportion of underutilisation with 26% of SOMIH households living in underutilised dwellings. However, underutilisation data were not available for the Northern Territory for SOMIH or community housing.
Between 2014 and 2018, underutilisation rates among social housing programs have varied. Some of this change can be attributed to reporting and data availability and therefore, data may not be comparable over time.
Public housing underutilisation has remained steady between 2014 and 2019, at around 16–17%, while there has been some variation for community housing and SOMIH households (Figure SUITABILITY.2, Supplementary table SUITABILITY.2). Underutilisation for households in SOMIH dwellings increased in recent years from around 23% in 2014 to 26% in 2019. For community housing, rates of underutilisation have been variable over these years fluctuating between 9–12%.
Location
The proportion of households in underutilised dwellings varied by state and territory and remoteness area among the social housing programs (Supplementary tables SUITABILITY.3 and SUITABILITY.5). Key results at 30 June 2019 include:
- For public housing, South Australia (27%) had the highest proportion of households in underutilised dwellings compared with the Northern Territory (8%) which had the lowest, consistent with previous years.
- Of the available SOMIH household data, around 1 in 3 households in South Australia (32%) and New South Wales (30%) were living in underutilised dwellings; 1 in 5 in Tasmania and Queensland (20% each).
- For community housing, 22% of households in South Australia were reported as living in underutilised dwellings, which has been consistent since 2016. In Tasmania, there has been some variability, with underutilisation varying between 14–25% since 2014. In 2019, the underutilisation rate for Tasmania was 17%.
- Of the public housing households, those in Outer regional areas were most likely to be living in underutilised dwellings (21%), with households in Remote areas being least likely (15%). This is consistent with data from recent years.
For SOMIH, the proportion of underutilised households ranged from 20% in Very remote areas to 29% in Major cities (Supplementary table SUITABILITY.5)
- AIHW (Australian Institute of Health and Welfare) 2014. Housing circumstances of Indigenous households: tenure and overcrowding. Cat no. IHW 132. Canberra: AIHW.
- AIHW 2019. Aboriginal and Torres Strait Islander people: a focus report on housing and homelessness. Cat. no. HOU 301. Canberra: AIHW.
- Booth A & Carroll N 2005. Overcrowding and Indigenous health in Australia. Centre for Economic Policy Research Discussion Paper no. 498. Canberra: Centre for Aboriginal Economic Policy Research, Australian National University.
- CMHC (Canada Mortgage and Housing Corporation) 2014. Housing in Canada Online - Definitions of Variables. Viewed 10 April 2019.
- Memmott P, Birdsall-Jones C, Go-Sam C, Greenop K & Corunna V 2011. Modelling crowding in Aboriginal Australia. AHURI Positioning Paper No.141. Melbourne: Australian Housing and Urban Research Institute.
- Memmott P, Long S & Chambers C 2003. Categories of Indigenous ‘homeless’ people and good practice responses to their needs. AHURI Positioning Paper No. 53. Melbourne: Australian Housing and Urban Research Institute.
- Pholeros P 2010. Will the Crowding Be Over or Will There Still Be Overcrowding in Indigenous Housing?: Lessons from the Housing for Health Projects 1985-2010 (online). Developing Practice: The Child, Youth and Family Work Journal, No. 27, Summer 2010: 8–18. Viewed 4 June 2019. ISSN: 1445-6818.
- SCRGSP (Steering Committee for the Review of Government Service Provision) 2016. Overcoming Indigenous Disadvantage: Key Indicators 2016. Canberra: Productivity Commission.


