Priority groups and waiting lists
On this page
Quick facts
- The majority of new housing allocations were provided to those in greatest need; 76% of new housing allocations in public housing, 60% in SOMIH and 66% in community housing were in greatest need.
- Almost half (48%, or around 7,200 households) of the newly allocated greatest need households were experiencing homelessness prior to commencing their public housing tenancy in 2018–19. A further 38% were at risk of homelessness.
- Almost half of newly allocated households in public housing went to households with both greatest and special needs (48%, or 9,400 households).
- In 2019, there were 148,500 households on the waiting list for public housing, down from 154,600 in 2014.
- Households in greatest need spent less time on waiting lists than other households. Of the greatest need households, 2 in 5 (41%) newly allocated public housing households and 3 in 5 (55%) newly allocated SOMIH households were allocated housing in less than 3 months.
Priority groups
Historically, social housing has been targeted towards low-income families but, in recent years, the focus has shifted towards supporting a highly diverse range of vulnerable groups such as those experiencing trauma, disadvantage and/or financial instability (Groenhart et al. 2014).
Entry into social housing is determined by policies for eligibility and entitlement (e.g. type and location of the property) (Powell et al 2019). Social housing is generally allocated according to priority needs, with allocations made on the basis of identifying those people with the greatest need (e.g. people experiencing homelessness) and those with a special need for housing assistance (e.g. people with disability).
Data on household need status for Indigenous community housing were not available.
Greatest need
Public housing, SOMIH and community housing programs prioritise household allocations by assessing their greatest need status (SCRGSP 2019). People experiencing homelessness identified as being in greatest need, but so too are those with the severest of living circumstances, who are deemed to be ‘at risk of homelessness’ and therefore also in greatest need (Powell et al 2019).
Assessing greatest need status
Greatest need applies to households if, at the time of allocation, household members were subject to one or more of the following circumstances:
- they were experiencing homelessness
- they were at risk of homelessness, including
- their life or safety was threatened within existing accommodation
- a health condition was exacerbated by existing accommodation
- their existing accommodation was inappropriate to their needs
- they were experiencing very high rental costs.
For more information, see METEOR.
States and territories may use different criteria for classification of greatest need.
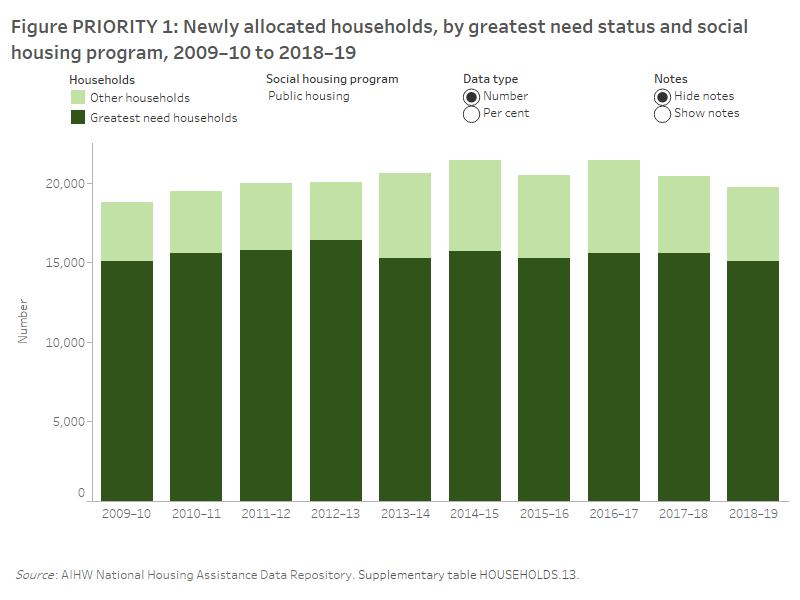
In 2018–19, the majority of new public housing allocations were provided to households in greatest need (76%, or 15,100 households). This proportion has fluctuated between 73–82% from 2009–10 to 2018–19 (Figure PRIORITY.1, Supplementary table HOUSEHOLDS.13).
Figure PRIORITY.1: Newly allocated households, by greatest need status and social housing program, 2009–10 to 2018–19. This vertical stacked bar graph shows, for public housing, community housing and SOMIH, the number of greatest needs households was higher than the number of other households, from 2009–10 to 2018–19. In 2018–19, the majority of new public housing allocations were provided to households in greatest need (76%). Between 2009–10 and 2018–19, this proportion fluctuated between 73–82%. In 2009–10, 57% of newly allocated SOMIH dwellings were provided to households in greatest need; this increased to 60% in 2018–19. Prior to 2017–18, the proportion of community housing allocations to households in greatest need was increasing, from 63% in 2009–10 to 86% in 2016–17; the proportion then decreased to 66% in 2018–19.

Three in 5 (60%) newly allocated SOMIH dwellings were provided to households in greatest need in 2018–19 (Figure PRIORITY.1, Supplementary table HOUSEHOLDS.13). In 2018–19, there were over 400 new allocations to greatest need households (excludes Tasmania and the Northern Territory, as greatest need data were not available).
Prior to 2018–19, community housing allocations to households in greatest need were increasing year to year, from 63% in 2009–10 to 82% in 2017–18. The proportion of households in greatest need that were newly allocated dwellings was considerably lower in 2018–19 at 66%. Stock transfers over time have impacted on the number of allocations by greatest need. See the Data quality statement for further information.
Main reason for greatest need
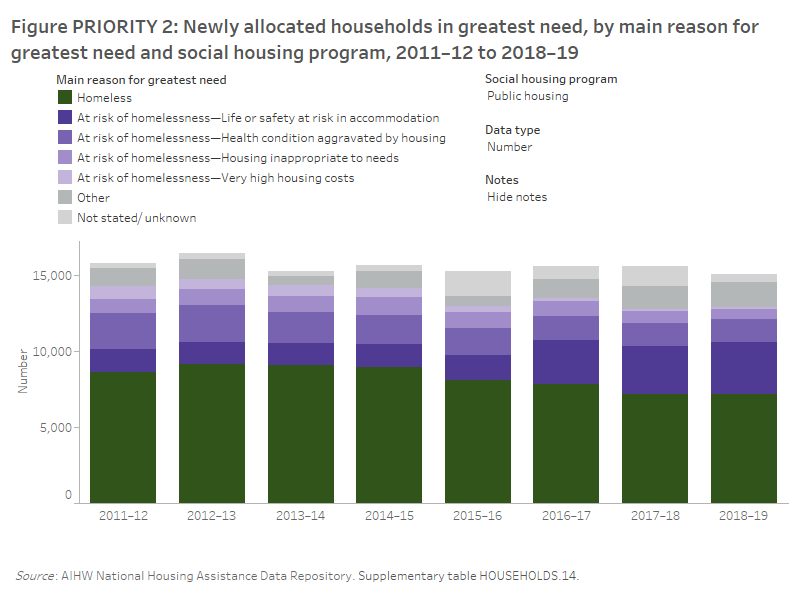
In 2018–19, of the 15,100 newly allocated public housing households in greatest need:
- 48% (7,200 households) were experiencing homelessness at the time of allocation.
- 38% (5,800 households) were at risk of homelessness, of those:
- 3,500 reported the main reason for their greatest need was that their life or safety was at risk in their accommodation.
- A further 1,500 households reported a health condition aggravated by housing as their main reason.
- 14% of households were other or not stated (Figure PRIORITY.2, Supplementary table HOUSEHOLDS.14).
Figure PRIORITY.2: Newly allocated households in greatest need, by main reason for greatest need and social housing program, 2011–12 to 2018–19. This vertical stacked bar graph shows the main reason for greatest need of newly allocated households. In 2011–12, the main reason for greatest need in public housing was homelessness (55%); this decreased to 48% in 2018–19. For those at risk of homelessness in public housing, in 2011–12, the main reason for greatest need was health condition aggravated by housing (15%); in 2018–19, the main reason was life or safety at risk in accommodation (23%).

In 2018–19, similar numbers of newly allocated SOMIH households in greatest need reported either experiencing homelessness (40%, or around 180 households) or being at risk of homelessness (40%, or around 180 households). A further 20% (90 households) had other or not stated/unknown need status.
Data on the main reason a household was considered to be in greatest need for community housing were not complete due to data quality issues. Based on the available data, in 2018–19, of the newly allocated greatest need households in community housing where the main reason was known, more households were at risk of homelessness (60%, or 7,800 households) than experiencing homelessness (39%, or 5,000 households) with 1% (155 households) not stated (Figure PRIORITY.2, Supplementary table HOUSEHOLDS.14).
Special needs
Households seeking assistance from social housing providers often have members with special needs. Some households may have multiple special needs. The definition of special needs is different for the different social housing programs.
Assessing special needs status
For public housing, special needs households include those with:
- a member with disability,
- a main tenant younger than 25 years or older than 75, or
- one or more members who identify as Aboriginal and/or Torres Strait Islander.
As SOMIH is an Indigenous targeted program, Indigenous households in SOMIH are not considered special needs households. For SOMIH, special needs households are only those that have:
- a member with disability or
- a main tenant under 25 years or over 50 (SCRGSP 2019).
A household may have more than one 'Special needs' reason. In 2018–19, there were 11,900 newly allocated public housing households with special needs; representing 60% of all newly allocated households. Of these:
- over half (52%, or 6,200 households) had at least one member with disability
- 2 in 5 (43%, or 5,100 households) had at least one Indigenous member
- 1 in 5 (21%, or 2,600 households) had a main tenant aged under 25
- 7% (almost 800 households) had a main tenant aged 75 or over (Supplementary table HOUSEHOLDS.16).
In 2018–19, of the almost 600 newly allocated SOMIH households with special needs:
- over half (54%, or 300 households) had a main tenant aged 50 and over
- 3 in 10 (28%, or 160 households) had a main tenant aged under 25 years
- 3 in 10 (29%, or 160 households) contained at least one member with disability.
Greatest and special needs
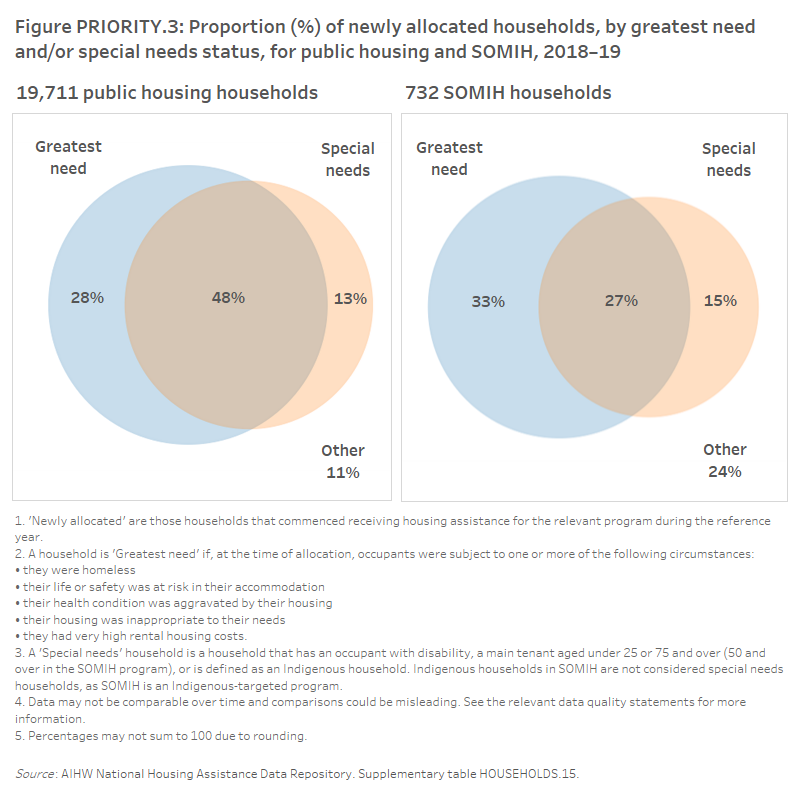
Greatest and special needs categories are not mutually exclusive and one or more household members may fit into a number of categories within each priority group or across priority groups (Figure PRIORITY.3). Households with members that have both greatest and special needs may be some of the most vulnerable households and may require high levels of care and support.
In 2018–19, of the newly allocated households in public housing:
- almost half were both greatest need and special needs households (48%, or 9,500 households)
- one-fifth were greatest need only (no special needs) (22% or 4,300)
- over 1,200 (6%) were neither greatest need nor special needs households.
In 2018–19, of the newly allocated households in SOMIH:
- more than one-quarter were both greatest need and special needs households (27%, or 200 households).
- a higher proportion had greatest need only (no special needs) (32% or 230 households)
- around one-fifth were neither greatest need nor special needs (21% or 160) (Figure PRIORITY.3, Supplementary table HOUSEHOLDS.15).
Figure PRIORITY.3: Proportion (%) of newly allocated households, by greatest need and/or special needs status, for public housing and SOMIH, 2018–19. The venn diagram shows the overlap of greatest needs and special needs newly allocated households in public housing and SOMIH. In 2018–19, of the newly allocated households in public housing, 28% had greatest needs only, 13% had special needs only and 48% were both greatest needs and special needs households. Of the newly allocated households in SOMIH, 33% had greatest needs only, 15% had special needs only and 27% were both greatest needs and special needs households.

For information about households on the waiting list identified as having greatest need, see Wait list and wait times.
Waiting lists
Fluctuations in the numbers of people on waiting lists are not necessarily measures of changes in underlying demand for social housing. A number of factors may influence the length of wait lists including changes to allocation policies, priorities and eligibility criteria put in place by state/territory housing authorities (Dockery et al 2008). Further, some people who wish to access social housing may not apply due to the long waiting times or lack of available options in their preferred location. It is also important to note that in some states/territories applicants may be on more than one waiting list and, as such, combined figures are expected to be an overestimate of the total. For further details, see the Data quality statements.
Wait list data for both community housing and Indigenous community housing were unavailable.
Access to social housing is managed using waiting lists, with priority given to those considered to be high priority applicants (see priority applicants section for further information about these groups). At 30 June 2019, the number of households on the waiting list (excluding transfers) were:
- 148,500 households on a waiting list for public housing (down from 154,600 at 30 June 2014)
- 12,100 households on a wait list for SOMIH dwellings (up from 8,000 at 30 June 2014) (Supplementary table HOUSEHOLDS.22).
Of those new applicants on the wait list at 30 June 2019:
- 52,600 households on the waiting list for public housing were in greatest need (or 35%); an increase from 45,800 households in greatest need on the public housing waiting list at 30 June 2018.
- almost 5,700 households were in greatest need and waiting for SOMIH dwellings, up from 4,700 at 30 June 2018.
Waiting times
The waiting times for social housing programs differ between different areas across Australia, with waiting times for particular high demand city areas often being far greater than other areas (NSW government 2018). They can also differ based on the size of the dwelling needed, and differ for people deemed to be in a priority group for social housing (such as those experiencing homelessness or with disability).
Time spent on the waiting lists for social housing can be measured by looking at newly allocated households and can be differentiated according to greatest or special needs status. In this analysis, total waiting list times for those in greatest need were calculated from the date of greatest need determination to the housing allocation date. For other households not in greatest need, the waiting list time is from housing application to housing allocation. For the new special needs households, the waiting time represents the period from the housing application to the housing allocation.
Of all newly allocated public housing households in 2018–19, 38% spent less than six months on the waiting list, including 26% who spent less than three months (Supplementary table HOUSEHOLDS.18). For SOMIH, over half (58%) of newly allocated households spent less than six months on the waiting list, including 46% who spent less than 3 months.
Waiting time data for both community housing and Indigenous community housing were unavailable.
Greatest need and waiting times
An assessment of greatest need status is made of households applying for social housing (public housing, state owned and managed Indigenous housing (SOMIH) and community housing) and largely relates to experiences of homelessness. For more detailed information, see Priority groups: greatest and special needs.
In this analysis, total waiting list times for newly allocated households in greatest need were calculated from the date of greatest need determination to the housing allocation date. For other households not in greatest need, the waiting list time is from housing application to housing allocation. Households in greatest need may have already spent time on the waiting lists before the greatest need determination.
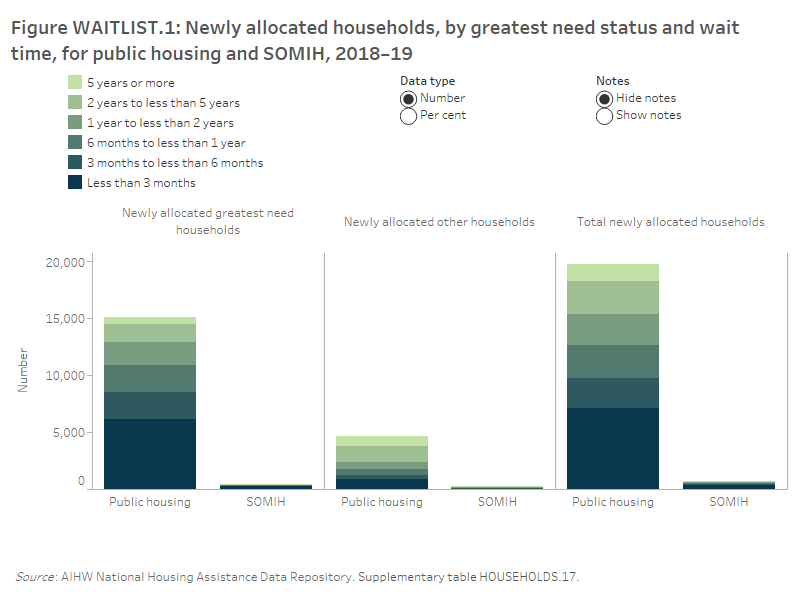
In 2018–19, among new allocations to greatest need households, the majority (72%, or 10,800 households) received public housing within one year of the household being on the waiting list (Figure WAITLIST.1). By contrast, far fewer other households who were not in greatest need (38% or 1,800) were allocated housing within a year on the waiting list. Almost half (48%) of newly allocated households not in greatest need, spent more than 2 years on the waiting list before public housing allocation (Supplementary table HOUSEHOLDS.17). For those in greatest need, 14% spent more than 2 years on the waiting list for public housing, including 10% who spent between 2–5 years.
Similarly, for SOMIH, newly allocated households in greatest need were less likely than other households to spend an extended period of time on waiting lists. In 2018–19, 87% of newly allocated SOMIH households in greatest need spent less than 12 months on waiting lists (Figure WAITLIST.1). This includes 55% who spent less than 3 months. In comparison, 51% of newly allocated households not in greatest need were on the SOMIH waiting list for less than 12 months, including 22% spending less than 3 months (Supplementary table HOUSEHOLDS.17).
Figure WAITLIST.1: Newly allocated households, by greatest need status and wait time, for public housing and SOMIH, 2018–19. This vertical stacked bar graph shows the highest proportion of newly allocated greatest need households in both public housing (41%) and SOMIH (55%) spent less than 3 months on a wait list. For newly allocated other households, the highest proportion of households in both public housing (29%) and SOMH (26%) spent 2 years to less than 5 years on a wait list. For newly allocated other households, 48% of public housing and 30% of SOMIH spent 2 years to 5 years or more on a wait list.

Special needs and waiting times
Households seeking assistance from social housing providers often have members with special needs. Some households may have multiple special needs. The definition of special needs is different for different social housing programs. For more detailed information, see Priority groups: greatest and special needs.
For the newly allocated special needs households, the waiting list time represents the period from the housing application to the housing allocation. The time spent on the waiting list for new special needs households in public housing varied, with around:
- 3,100 households waiting for less than 3 months (or 26%)
- 3,300 households waiting between 3 months and less than 1 year (or 28%)
- 4,100 households waiting between 1 year to less than 5 years (or 34%) and
- 1,400 households waiting for more than 5 years (or 11%) (Supplementary table HOUSEHOLDS.18).
- Dockery A, Ong R, Whelan S & Wood G 2008. The relationship between public housing wait lists, public housing tenure and labour market outcomes. AHURI Research Report No. 9. Melbourne: Australian Housing and Urban Research Institute Limited.
- Groenhart L, Burke T & Ralston L 2014. Thirty years of public housing supply and consumption: 1981–2011. AHURI Final Report No. 231. Melbourne: Australian Housing and Urban Research Institute.
- NSW Government, Department of Communities and Justice 2018. Waiting times for social housing last published 24 January 2018. Viewed 12 March 2020.
- Powell A, Meltze, A, Martin C, Stone W, Liu E, Flanagan K, Muir K & Tually S 2019. The construction of social housing pathways across Australia. AHURI Final Report No. 316. Melbourne: Australian Housing and Urban Research Institute.
- SCRGSP (Steering Committee for the Review of Government Service Provision) 2019. Report on Government Services 2020 – Housing. Canberra: Productivity Commission.


