Other unintentional causes
Injury hospitalisation rate due to other unintentional causes increased
The age-standardised rate (ASR) of injury hospitalisations among women due to other unintentional causes has generally increased over the past decade with some fluctuations in the overall upwards trend (Figure 34). The ASR of injury death for women due to other unintentional causes peaked at 1.3 per 100,000 population in 2014–15 before dropping to 0.6 per 100,000 in 2019-20, the lowest ASR in the last ten years. The deaths ASR has steadily increased from 2019-20 to 2022–23.
Figure 34: Number and age-standardised rate (per 100,000) of injury hospitalisations and deaths among women due to other unintentional causes, Australia, 2013–14 to 2022–23
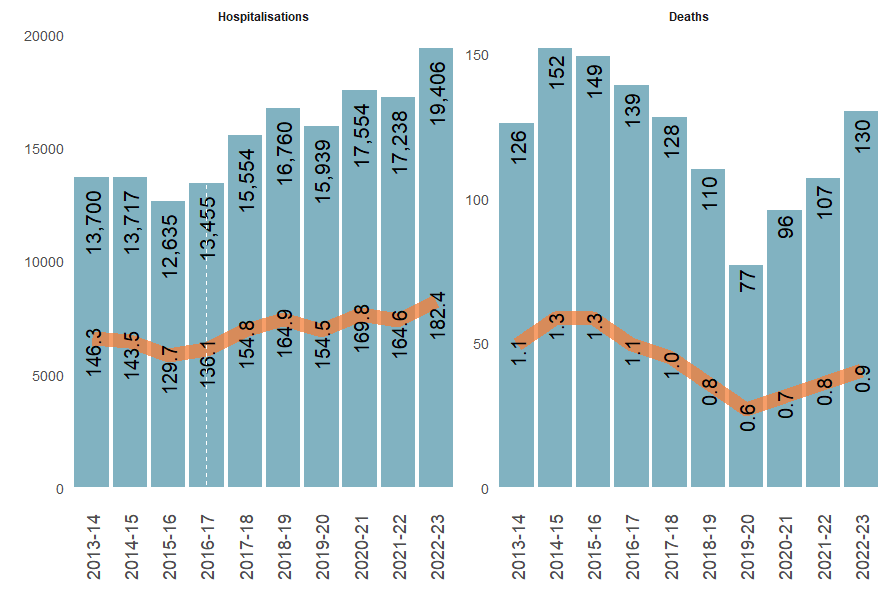
Sources: AIHW National Hospital Morbidity Database, AIHW National Mortality Database, and ABS National, state and territory population.
Notes:
- Only includes records where patient was aged 19 and over and patient’s sex recorded as female.
- Rates are age-standardised per 100,000 population.
- Columns are case counts, the line graph presents age-standardised rate per 100,000 population.
- The dashed line presents a break in the time series, see Technical notes for detail.
Most injury hospitalisations and deaths due to other causes were due to an unspecified factor
Other unintentional causes are comprised of 2 ICD-10-AM cause codes:
- Exposure to other specified factors (X58)
- Exposure to unspecified factor (X59).
Across all age groups, exposure to unspecified factor (X59) accounted for most injury hospitalisations and deaths among women due to other unintentional causes (Figure 35).
Figure 35: Number and crude rate (per 100,000) of injury hospitalisations and deaths among women due to other unintentional causes by age group, Australia, 2022-23
Injury hospitalisations and deaths due to other unintentional causes by age group showing exposure to unspecified factor as most common specific cause of injury hospitalisations and death for all age groups.
