Severity
There are multiple ways the severity, or seriousness, of an injury can be measured. Hospitalisation severity metrics include:
ICU: An Intensive Care Unit (ICU) provides care to patients who are critically unwell and require complex, multisystem life support.
CVS: Continuous Ventilatory Support (CVS) is when a patient breathes via an artificial airway with the aid of a machine.
ALOS: Average length of stay (ALOS) is the average number of days a group of patients remain in hospital receiving treatment.
In-hospital deaths: When a person is admitted to hospital, and dies despite the treatment provided, that can be an indication of the severity of their injuries.
Emergency department (ED) metrics include:
Triage category: Every ED presentation is assigned a triage category based on the urgency in which the patient requires medical care.
End status: A person can leave the ED in different ways. People admitted to hospital are likely to have more serious injuries.
Women hospitalised for thermal causes have the longest hospital stays
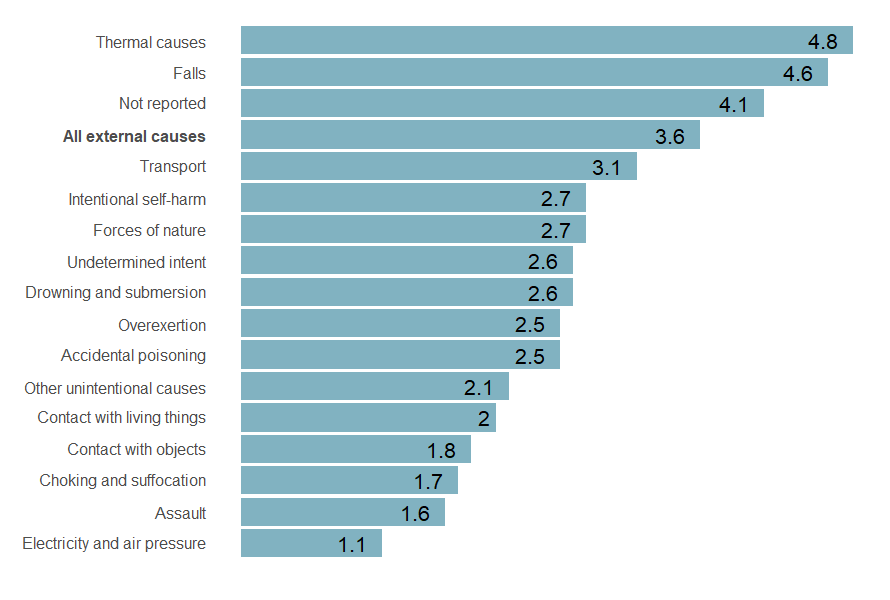
Where cause of injury was known, women hospitalised for injuries from thermal causes, such as contact with hot tap-water or exposure to controlled fire in building structure, had the longest average length of stay (ALOS) of 4.8 days (Figure 8). This was consistent across all age groups.
Figure 8: Average length of stay in hospital (in days) for women by cause of injury, Australia, 2022–23
Sources: AIHW National Hospital Morbidity Database.
Notes:
- Only includes records where patient was aged 19 and over and patient’s sex recorded as female.
- Average length of stay (ALOS) is the average number of days the group of patients stayed in hospital receiving treatment. Length of stay calculations include transfer hospitalisations.
- Records where external cause of injury was not reported are excluded from display.
- Causes with low numbers of hospitalisation are excluded from display due to data volatility.
Internal organ, intracranial and poisoning or toxic effect injuries were the most severe types of injury for women
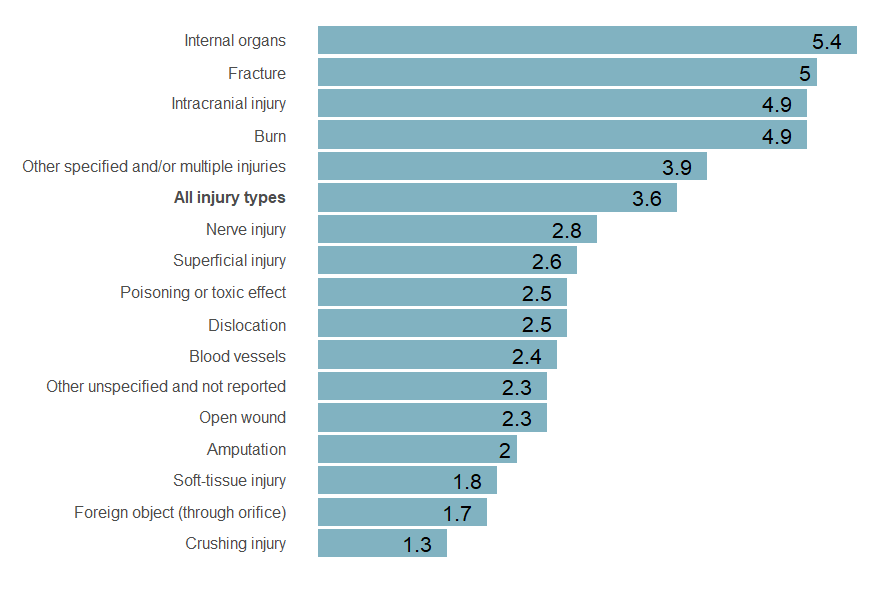
Women hospitalised for injuries sustained to their internal organs had the highest average length of stay (ALOS) of 5.4 days in 2022–23 (Figure 9). Women hospitalised for internal organ injuries also had the highest proportion who spent time in an Intensive Care Unit (ICU) during their hospital stay (220 cases, 16.3%), second highest proportion who required Continuous Ventilatory Support (CVS) (67 cases, 4.9%), and second highest proportion of women who died in hospital (18 cases, 1.3%) (Table 3).
Women hospitalised for intracranial injuries had the highest proportion of in-hospital deaths (392 cases, 4.8%) and third highest ALOS of 4.9 days.
Women hospitalised for poisoning and toxic effect injuries had the highest proportion who required CVS (1,335 cases, 9.3%), and the second highest proportion of an ICU stay (2,179 cases, 15.2%).
Figure 9: Average length of stay (in days) for women by type of injury, Australia, 2022–23
Sources: AIHW National Hospital Morbidity Database.
Notes:
- Only includes records where patient was aged 19 and over and patient’s sex recorded as female.
- Average length of stay (ALOS) is the average number of days the group of patients stayed in hospital receiving treatment. Length of stay calculations include transfer hospitalisations.
- Type of injury is derived from principal diagnosis.
- Types of injury with low numbers of hospitalisation are excluded from display due to data volatility.
Severity measure | Internal organ injuries | Poisoning and toxic effect injuries | Intracranial | Fracture | All injury types |
|---|---|---|---|---|---|
Average length of stay (ALOS) | 5.4 | 2.5 | 4.9 | 5.0 | 3.6 |
Proportion (%) spent time in Intensive Care Unit (ICU) | 16.3 | 15.2 | 6.1 | 2.0 | 2.5 |
Proportion (%) spent time on Continuous Ventilatory Support (CVS) | 4.9 | 9.3 | 3.5 | 0.3 | 1.0 |
Proportion (%) died in-hospital | 1.3 | 0.3 | 4.8 | 0.7 | 0.7 |
Sources: AIHW National Hospital Morbidity Database.
Notes:
- Only includes records where patient was aged 19 and over and patient’s sex recorded as female.
- Average length of stay (ALOS) is the average number of days the group of patients stayed in hospital receiving treatment. Length of stay calculations include transfer hospitalisations.
- Type of injury is derived from principal diagnosis.
- All injury types includes internal organ and poisoning and toxic effect injuries in the total calculations.
Most injury ED injury presentations for women were triaged as semi-urgent
Nearly 1 in 3 injury emergency department (ED) presentations for women (161,176 presentations, 30%) arrived by ambulance or rescue service.
Every ED presentation is assigned one of 5 triage categories. These categories are used to prioritise patients and help determine the urgency of their condition to ensure they receive medical assessment and treatment within a clinically appropriate timeframe. Each triage category has a set maximum appropriate wait time between when the patient is triaged and seen for medical care.
Crude rate of ED presentation end status by age group showing women aged 65+ most likely to be admitted to hospital and referred to another hospital for admission from their ED presentation and women aged 19 to 24 were more likely to leave at own risk, not wait to be seen, and depart without being admitted.
