Injury trends over the last decade
-

Hospitalisation rates have decreased
From 2017–18 to 2022–23
- Hospitalisation rates decreased from 1,899.4 to 1,846.6 per 100,000 population
- The number of injury hospitalisations increased
-

Death rates have increased
From 2017–18 to 2022–23
- Death rates increased from 41.5 to 43.1 per 100,000 population
- The number of injury deaths increased
Injury hospitalisation and death trends will present data from the last ten years, 2013–14 to 2022–23. Injury Emergency Department (ED) presentation trends will present data from 2017-18 to 2022–23. This is due to quality issues relating to injury case identification in data before 2017-18, see Technical notes for more information.
The numbers of injury hospitalisations, deaths and ED presentations among women have all increased since 2017–18 (Figure 1). From 2017–18 to 2022–23, the age-standardised rates for injury deaths among women have increased, while hospitalisation rates have decreased (Figure 1). The rates for injury ED presentations also saw an increase over this period, however there was more variance in the year-to-year changes than for hospitalisations or deaths.
Hospitalisation, death and ED presentation rates dropped in 2019–20 and this irregularity is likely due to the impacts of COVID-19 restrictions. This drop was immediately followed by a 6% spike in 2020–21 rates for hospitalisations (1,864.4 to 1,982.5 per 100,000) before returning to trend from 2021–22. A similar pattern was observed for injury ED presentations.
Figure 1: Number and age-standardised rate (per 100,000) of injury hospitalisations, deaths and ED presentations, 2013–14 to 2022–23
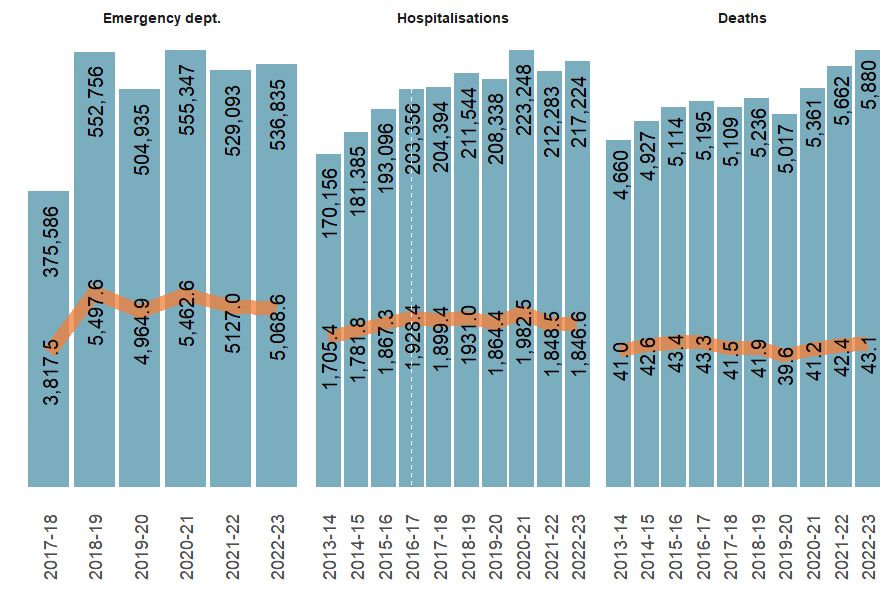
Sources: AIHW National Hospital Morbidity Database, AIHW National Mortality Database, AIHW National Non-Admitted Patient Emergency Department Care Database, and ABS National, state and territory population.
Notes:
- Only includes records where patient was aged 19 and over and patient’s sex recorded as female.
- Columns are case counts while line graphs indicate age-standardised rates per 100,000 population.
- There is a break in timeseries in hospitalisation data indicated by the dotted vertical line. Please see Technical notes for detail.
Patterns of hospitalisations and deaths among women varied by cause of injury
Trends in age-standardised rates of injury hospitalisations and deaths among women varied by cause and data source (Figure 2). Between 2017–18 and 2022–23, hospitalisation rates decreased for most causes except contact with living things, contact with objects and other unintentional causes, where rates increased between 2017–18. The trends over time also differed between hospitalisations and deaths for most causes.
Figure 2: Number and age-standardised rate (per 100,000) of injury hospitalisations and deaths by cause, 2013–14 to 2022–23
Trends of numbers and rates of women’s injury hospitalisations and deaths by external cause of injury, showing decreased hospitalisation rates since 2017-18 for most causes, while corresponding rates for deaths often increased.
