Age groups
Women aged 65 years and over were more likely to die and be hospitalised due to injury, while women aged 19 to 24 years were more likely to present to ED for injuries
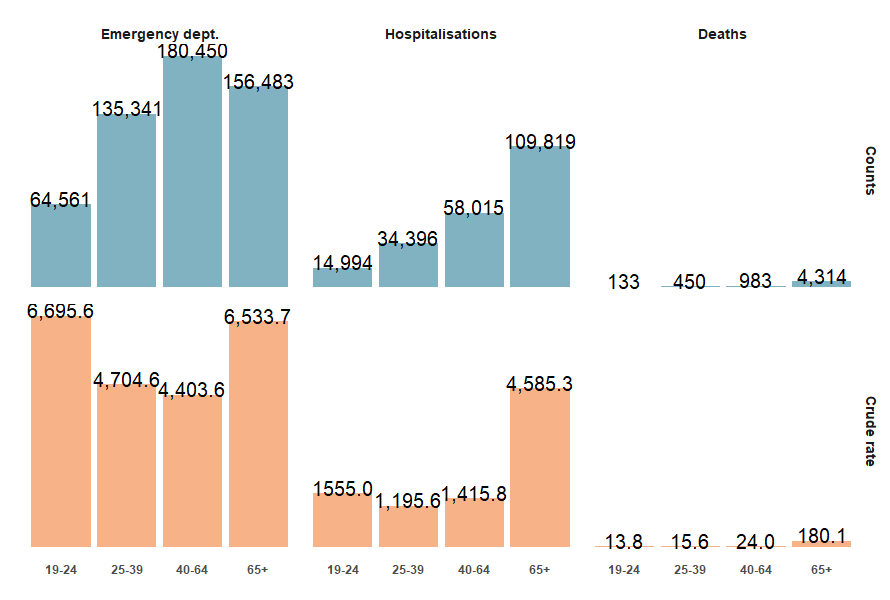
In 2022–23, women aged 65 and over (women aged 65 years and over) made-up half of injury hospitalisations (109,819 hospitalisations, 51%) among women and had the highest rate of hospitalisation (4,585.3 per 100,000 population) of all age groups (Figure 44). This rate was almost 3 times higher than the second highest rate of hospitalisation for women aged 19 to 24 (1,555.0 per 100,000 population). The magnitude of this discrepancy could be explained by the high prevalence of falls, the commonest injury type, among women aged 65 years and over.
Women aged 65 years and over made up most of the recorded injury deaths in 2022–23 (4,314 deaths, 73%) and had a significantly higher rate of injury deaths (180.1 per 100,000 population) than any other age group (Figure 44). This rate is over 7 times higher than the second highest rate of injury deaths which was for women aged 40 to 64 years (983 deaths, 24 per 100,000 population). This is expected as mortality increases with age.
In 2022–23, women aged 19 to 24 years had the highest rate of injury ED presentations (6,695.6 per 100,000 population) compared to all other age groups (Figure 44). Women aged 65 years and over had the second highest rate of injury ED presentations (6,533.7 per 100,000 population).
Figure 44: Number and crude rate (per 100,000) of injury hospitalisations, deaths and ED presentations for women by age group, Australia, 2022–23
Sources: AIHW National Non-Admitted Patient Emergency Department Care Database, AIHW National Hospital Morbidity Database, AIHW National Mortality Database, and ABS National, state and territory population.
Notes:
- Only includes records where patient was aged 19 and over and patient’s sex recorded as female.
- Rates are crude per 100,000 population.
- Rates where underlying numerator count is under 10 are excluded from display.
- Hospitalisation counts under 5 are excluded from display.
- Death counts under 3 are excluded from display.
For more information, see supplementary data tables.