Transport
Most recent transport hospitalisation rates are the lowest in a decade
Rates of injury hospitalisation due to transport accidents among women have fluctuated since 2017-18, peaking in 2018-19 with an age-standardised rate (ASR) of 193.4 per 100,000 population and dropping in 2022–23 to the lowest recorded ASR in the last 10 years of 170.4 per 100,000 population (Figure 29).
For transport deaths, the highest ASR was observed in 2015–16 (3.5 per 100,000 population) and declined to an ASR of 2.7 per 100,000 population in 2019-20 and remained unchanged until 2022–23 where the ASR increased up to 3.2 per 100,000 population.
Figure 29: Number and age-standardised rate (per 100,000) of transport injury hospitalisations and deaths among women, Australia, 2013–14 to 2022–23
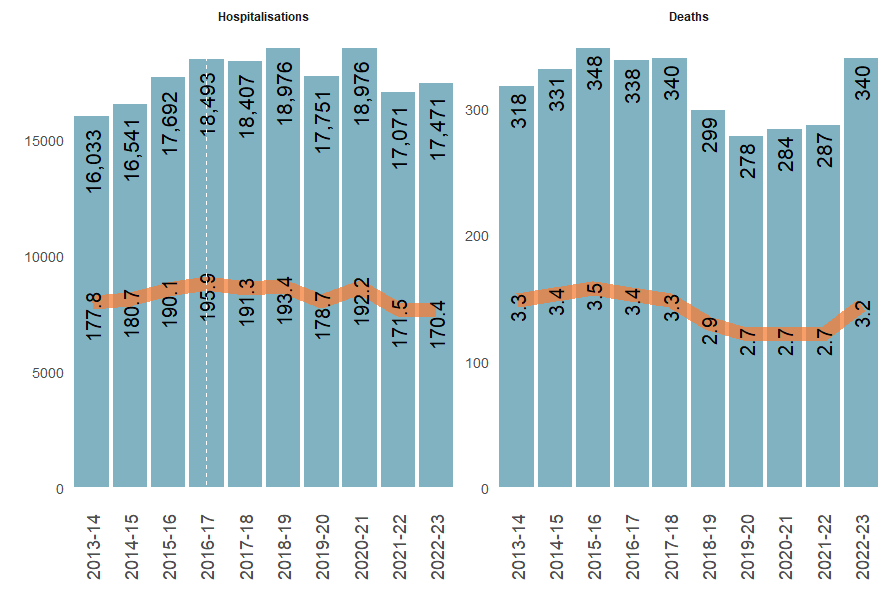
Sources: AIHW National Hospital Morbidity Database, AIHW National Mortality Database, and ABS National, state and territory population.
Notes:
- Only includes records where patient was aged 19 and over and patient’s sex recorded as female.
- Rates are age-standardised per 100,000 population.
- Columns are case counts, the line graph presents age-standardised rate per 100,000 population.
- The dashed line presents a break in the time series, see Technical notes for detail.
Cars accounted for over half of all transport accident injury hospitalisations and deaths
Figure 30: Number and age-standardised rate (per 100,000) of injury hospitalisations and deaths due to transport accidents among women by vehicle type, Australia, 2022–23
Vehicle type for injury hospitalisations and deaths due to transport accidents ranked descending by vehicle type showing car, pedal cycle and animal or animal-drawn vehicle most common vehicle involved in injury hospitalisations and car, pedestrian and other land transport most common vehicle types involved for injury deaths due to transport accidents.
Figure 31: Number of transport injury hospitalisations among women by vehicle type and counterpart, Australia, 2022–23
Number of injury hospitalisations due to transport accidents by vehicle type involved and counterpart showing car, pick-up truck or van the most common counterpart involved for most vehicle types and the next most common was a non-collision accident.

-

Trunk (thorax, abdomen, lower back, lumbar spine & pelvis)
5,658 hospitalisations, 32%, or ASR 54.3 per 100,000 population
Figure 32: Number and age-standardised rate (per 100,000) of transport accident injury hospitalisations among women by type of injury and body part injured, Australia, 2022–23
Body part injured by type of injury heatmap table showing fractures to the trunk, to the shoulder and upper limb and to the hip and lower limb were the most common injuries women were hospitalised with due to a transport accident.

Figure 33: Number and crude rate (per 100,000) of transport-related injury hospitalisations and deaths by age group and type of vehicle, Australia, 2022–23
Injury hospitalisations and deaths due to transport accidents by age group showing women aged 19 to 24 having highest rates if injury hospitalisation and injury death for most vehicle types and there was some variation across the vehicle types.
