COVID-19 impact on alcohol and other drug treatment services
Key Findings
Alcohol and Other Drug (AOD) treatment services reported changes in service usage and impacts on treatment provision in response to the COVID-19 pandemic. Nationally, a comparison of quarterly trends in AOD treatment episodes across the four main waves of COVID-19 waves from 2018–19 to 2021–22 showed:
- decreases in rehabilitation during Apr–Jun 2020 continued to Jun 2022 due to ongoing public health restrictions which reduced availability of treatment places
- the initial increases in counselling between Apr–Dec 2020 were followed by declines to Jun 2022
- more changes in treatment episodes for rehabilitation and counselling were observed in Major cities and Inner regional areas than other areas
- more changes in treatment delivered in residential, home, and outreach settings were observed in Major cities and Inner regional areas than other areas
- the quarterly pattern of AOD treatment shows that for most AOD treatments the total number of episodes continued to remain lower in 2021–22 compared with pre-pandemic levels (2018–19).
In response to the COVID-19 pandemic, a range of public health regulations were introduced in Australia from mid-March 2020 to limit the spread of COVID-19. These public health regulations were extended in late March 2020 with all non-essential services ordered to temporarily close by the Australian Government.
International and domestic border restrictions and a suite of public health restrictions continued into 2022, which resulted in a slower progression of COVID-19 cases in Western Australia.
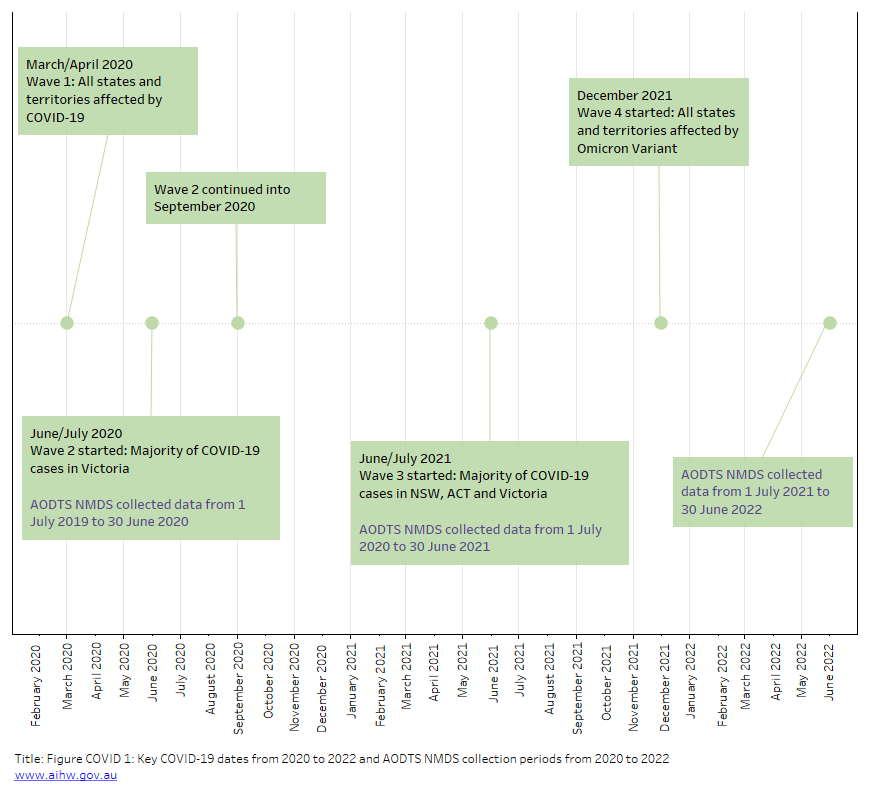
Figure COVID 1: Key COVID-19 dates from 2020 to 2022 and AODTS NMDS collection periods from 2020 to 2022
The flow chart shows that Wave 1 of the COVID-19 pandemic started in March/April 2020 (affecting all states and territories), Wave 2 started in June/July 2020 and continued into September 2020 (with most COVID-19 cases in Victoria), Wave 3 started in June/July 2021 (with most cases in NSW, ACT and Victoria), and Wave 4 started in December 2021 (the Omicron variant, affecting all states and territories). The AODTS NMDS 2021–22 collection includes all closed episode data up to 30 June 2022.
Access to alcohol and other drug treatment
A total of 228,451 treatment episodes were provided to people for their own or someone else’s alcohol and/or drug use in 2021–22, decreasing by 6% from the previous year (242,980 in 2020–21). The number of clients treated by publicly funded AOD treatment services similarly decreased (6.3% from 139,271 clients in 2020–21 to 130,525 in 2021–22). Taking into consideration population growth, this equates to 619 clients per 100,000 people in 2020–21, falling to 576 clients per 100,000 people in 2021–22.
From March 2020 onwards, states and territories reported that specialised treatments provided by AOD services were affected by the introduction of public health regulations. This included social distancing measures, which led to a reduction in the availability of treatment services as the number of people that could be accommodated or assessed across treatment settings was reduced to comply with this public health guideline. In response to the health regulations, treatment services adapted practices such as expanding access to online services and telehealth appointments.
Health regulations continued into 2021–22 and viewing quarterly trends provides insights into how services continued to adapt treatment practices. Nationally, the general pattern of AOD treatment showed an initial drop across most main treatments in wave one (Apr–Jun 2020) followed by increases in subsequent months before decreasing again in waves three and four (Apr–Dec 2021). This quarterly pattern shows that, for most treatments, the total number of closed treatment episodes remained lower in 2021–22 compared with previous years of the COVID-19 pandemic.
The type of main AOD treatment and where it is delivered are closely linked. For example:
- Adapting service delivery for treatment types such as assessments, counselling, and support and case management to better suit online or offsite (home) treatment settings. The increased reporting of ‘other’ treatment settings may reflect agencies adapting to telephone/video conference consultations.
- Treatment types provided by outreach services were limited due to the face-to-face nature of this service delivery.
- An increase in treatment types provided in non-residential treatment settings and the decreases in other delivery settings reflects services adapting to provide some treatments in different settings.
- Rehabilitation is mainly provided in a residential setting; decreases in bed-based rehabilitation service settings were due to continued public health restrictions, which reduced client capacity and thus availability of treatment places.
- Changes in treatment provided and where it was delivered during the four waves of COVID-19 were more noticeable in Major cities and Inner regional areas than other areas. The greater volume of clients and services in these areas contributed to these changes.
Note that the trends have been identified nationally and by remoteness areas; individual jurisdiction trends may differ.
The collection period for the Alcohol and Other Drug Treatment Services National Minimum Data Set (AODTS NMDS) is by financial year. To examine the impact of the pandemic, closed treatment episode data from 2018–19, 2019–20, 2020–21 and 2021–22 were analysed by quarterly periods and compared.
Comparison of quarterly financial year episode data allows for data collected for the four main waves of COVID-19 to be compared across 2018–19 (prior to COVID-19), 2019–20, 2020–21 and 2021–22 collection periods (Figure COVID 1).
Financial year data include treatment episodes that ended within the period and excludes those that were ongoing or new (not closed) within the reporting year. This will lead to an underestimation of the number of treatment episodes presented in this analysis. Quarters are presented as financial year quarters in this analysis; Q1=Jul–Sep, Q2=Oct–Dec, Q3=Jan–Mar, Q4=Apr–Jun.
For further information, see Key terminology and glossary.