Infants and young children (aged under 5)
Figure 1: Contribution of disease groups to total (DALY), non-fatal (YLD) and fatal (YLL) burden, First Nations infants and children under 5, 2022
Stacked bar chart showing proportions of burden by disease group. For this age group, most YLL comes from infant & congenital conditions, while most YLD comes from blood & metabolic conditions.

Among First Nations infants and children under 5 there was substantially more fatal than non-fatal burden (70% or 12,898 YLL and 30% or 5,430 YLD respectively) (figures 2 and 5), with each death in this age group contributing up to 90 YLL. Infant & congenital conditions contributed more than two-thirds of the fatal burden in this age group (71%), followed by injuries (16%) (Figure 1).
Blood & metabolic disorders and infectious diseases were the leading disease group contributors to non-fatal burden for First Nations children under 5 (accounting for 32% and 18% of YLD, respectively). Infant & congenital conditions accounted for only 4.7% of non-fatal burden for First Nations children under 5 (Figure 1).
Among First Nations children under 5, the contribution of fatal and non-fatal burden to total burden differed for each disease group (Figure 2). Among the highest burden disease groups:
- The burden from infant & congenital conditions and injuries was almost all fatal.
- The burden from blood & metabolic disorders and infectious diseases was mostly non-fatal.
Figure 2: Fatal (YLL) and non-fatal (YLD) burden as a proportion (%) of total burden (DALY), leading 6 disease groups, First Nations children under 5, 2022

Source: AIHW First Nations Burden of Disease Database
How does burden differ by sex?
Among First Nations children under 5, males experienced a higher proportion of the total burden (56% compared with 44%), fatal burden (56% compared with 44%) and non-fatal burden (54% compared with 46%) than females.
Infant & congenital conditions was the leading disease group contributor to total and fatal burden for both First Nations males and females in this age group. Blood & metabolic disorders was the leading disease group contributor to non-fatal burden for both males and females (Figure 3).
Figure 3: Contribution of disease groups to total (DALY), non-fatal (YLD) and fatal (YLL) burden, by sex, First Nations children under 5, 2022
Stacked bar chart showing proportional burden splits by sex. For both males and females, infant & congenital conditions contributed just over half of all burden.

Figure 4: Top 5 specific causes of total (DALY), non-fatal (YLD) and fatal (YLL) burden, First Nations children under 5, 2022
Tile map showing the top specific causes by sex and burden type. For both males and females, pre-term birth & low birth weight complications was the largest contributing individual cause of total burden.

To further explore the top specific causes across all stages of life, see the following interactive data visualisation:
- Dashboard 8: Top specific causes across the stages of life: This visualisation provides the top 5 causes contributing to burden for each age group, by sex.
Changes over time
Overall, the health of First Nations children under 5 improved over the period 2011 to 2022 (Figure 5).
There was a 15% decline in the age-specific rate of total burden between 2011 and 2022 (from 200 to 169 DALY per 1,000 people). Most of this decline was observed between 2018 and 2022, with a smaller decline between 2011 and 2018.
The decrease in total burden was driven by a reduction (of 20%) in the rate of fatal burden between 2011 and 2022. Over the same period there was no substantial change in non-fatal burden (Figure 5).
Figure 5: Change between 2011 and 2022 in the age-specific total (DALY), non-fatal (YLD) and fatal (YLL) burden rates (per 1,000 people), First Nations children under 5

Source: AIHW First Nations Burden of Disease Database
Changes by disease group
Over the period 2011 to 2022, for First Nations children under 5, among the highest burden disease groups there were decreases in the age-specific total burden rate from:
- infant & congenital conditions – a decrease of 17 DALY per 1,000 people, or 17%
- infectious diseases – a decrease of 5.2 DALY per 1,000, or 24%
An increase in burden was observed for blood & metabolic disorders (increase of 5.8 DALY per 1,000, or 43%).
Changes by specific causes
In both 2011 and 2022, the same 4 diseases were the leading causes of burden among First Nations children under 5, although there were changes in the rankings and age-specific burden rates among these causes (Figure 6).
There were decreases in the burden rate for:
- pre-term birth & low birthweight complications (24% decrease in rate), although it was the leading cause of burden in this age group in both 2011 and 2022
- SIDS (36% decrease in rate, and a decrease in ranking)
There were increases in the burden rate and ranking for:
- protein-energy deficiency (28% increase in rate)
- birth trauma & asphyxia (18% increase).
Figure 6: Changes in ranking and age-specific DALY rate (DALY per 1,000 people), leading specific causes of burden, First Nations children under 5, 2011 and 2022
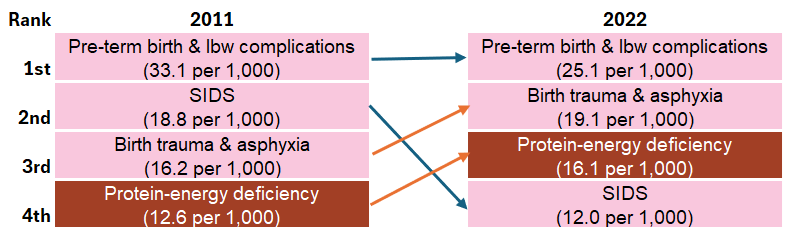
lbw low birthweight; SIDS sudden infant death syndrome.
Notes
- An increase in rank over time does not always mean the disease or injury has increased in the population, and vice versa. Therefore, changes in ranking of causes of deaths and disease burden over time should be interpreted with caution.
- Causes are presented in descending order, from highest age-specific rate to lowest age-specific rate, with arrows indicating either an increase (orange) or decrease (blue) in the age-specific rate over time.
- Cause rankings exclude ‘other' residual conditions from each disease group; for example, ‘other musculoskeletal conditions’.
- For information on colours used for each specific cause, see disease group colours for FNBDS 2022 colour legend.
Source: AIHW First Nations Burden of Disease Database
How big is the gap in this age group, and what causes it?
First Nations infants and children under 5 experienced disease burden at 2.1 times the rate for non-Indigenous children of this age in 2022 (169 compared with 80 per 1,000 people).
For infants and children under 5, infant & congenital conditions was the leading disease group contributor to the gap (representing 43% of the gap among children under 5). Blood & metabolic disorders, injuries, and infectious diseases were also important contributors to the gap in this age group (representing 19%, 17% and 12% of the gap, respectively) (see Figure 5 in Gap in disease burden section).