Total burden (DALY)
Figure 2: Proportion (%) of total burden (DALY) by disease group, First Nations people, 2022
A stacked bar chart showing the disease groups and the proportion of burden they contribute. Mental/substance use, injuries, cardiovascular, and cancer, are the largest disease groups in that order.

Disease groups had different proportions of fatal and non-fatal burden
The contribution of fatal burden and non-fatal burden to total burden differed greatly for each disease group (Figure 3).
Among the 5 highest burden disease groups:
- the burden from mental health conditions & substance use disorders and respiratory diseases was predominantly non-fatal.
- the burden from cancer & other neoplasms, injuries and cardiovascular diseases was predominantly fatal.
For other disease groups:
- the burden from infant & congenital conditions, gastrointestinal disorders, kidney & urinary diseases and infectious diseases was mostly fatal.
- the burden from neurological conditions, skin disorders, musculoskeletal conditions, reproductive & maternal conditions, and oral disorders was mostly non-fatal, and the burden from hearing & vision disorders exclusively non-fatal.
- the burden from blood & metabolic disorders and endocrine disorders (including diabetes) was made up of similar proportions of fatal and non-fatal burden.
Figure 3: Fatal (YLL) and non-fatal (YLD) burden as a proportion (%) of total burden (DALY), by disease group, First Nations people, 2022

Note: For the oral disease group, the YLL proportion is based on a small number of First Nations deaths so this result should be used with caution.
Source: AIHW First Nations Burden of Disease Database
To explore the contribution of fatal and non-fatal burden by sex, age and year for each disease group, see Dashboard 2: Fatal vs. non-fatal burden.
Top specific diseases contributing to burden
At the individual disease level, the leading 5 causes of total burden in 2022 were:
- coronary heart disease (6.0% of total burden)
- anxiety disorders (5.0%)
- suicide & self-inflicted injuries (4.5%)
- chronic obstructive pulmonary disease (COPD) (4.0%)
- depressive disorders (3.4%).
Together, these 5 causes accounted for nearly one quarter (23%) of the total burden in First Nations people (Figure 2).
To explore the leading causes of disease and injury in 2022 further, see Dashboard 5: Disease/injury-specific summary. This visualisation provides numbers, crude and age-standardised rates of total, fatal and non-fatal burden for the top 50 causes of total burden in 2022, along with charts showing the age and sex distribution for total burden. The information for each cause can be downloaded as a 1-page PDF.
COVID-19 burden in 2022
COVID-19 was not included in the 2018 or 2011 Australian Burden of Disease Studies, having emerged as a new disease in late 2019 and declared a pandemic in March 2020. It has been added to the FNBDS 2022 as a new cause in the infectious diseases group, and estimates of burden are provided for 2022 only.
Among First Nations people in 2022, COVID-19 was the:
- 14th leading cause of total burden (contributing 2.0% of DALY)
- 10th leading cause of fatal burden (contributing 2.7% of YLL)
- 23rd leading cause of non-fatal burden (contributing 1.3% of YLD).
COVID-19 was the largest overall contributor to the infectious diseases group, accounting for 47% of total burden, 49% of fatal burden and 42% of non-fatal burden in the disease group.
For COVID-19:
- females experienced more of the total burden than males (53% and 47%, respectively).
- almost one-third (31%) of the total burden was in those aged 45–64.
- the burden was predominantly fatal (68%).
- it was the 5th leading cause of fatal burden among First Nations people aged 75 and over (6.0%).
For information on how disease burden due to COVID-19 was estimated, refer to the Technical notes.
How does total burden differ between males and females?
First Nations males experienced more of the total disease burden (53% of total burden) than First Nations females (47%) in 2022. Dying from disease and injury accounted for more of the burden in males, while living with illness accounted for more of the burden in females (Figure 4).
Figure 6: Proportion (%) of total burden (DALY) by disease group and sex, First Nations people, 2022
A stacked bar chart showing the disease groups and the proportion of burden they contribute, by sex. For both sexes, mental/substance use disorders contribute the largest proportion of burden.

To further explore total, non-fatal and fatal burden by sex and disease group, see the interactive data visualisations: Dashboard 1: Burden of disease in Australia and Dashboard 2: Fatal vs. non-fatal burden.
Top specific causes contributing to total burden by sex
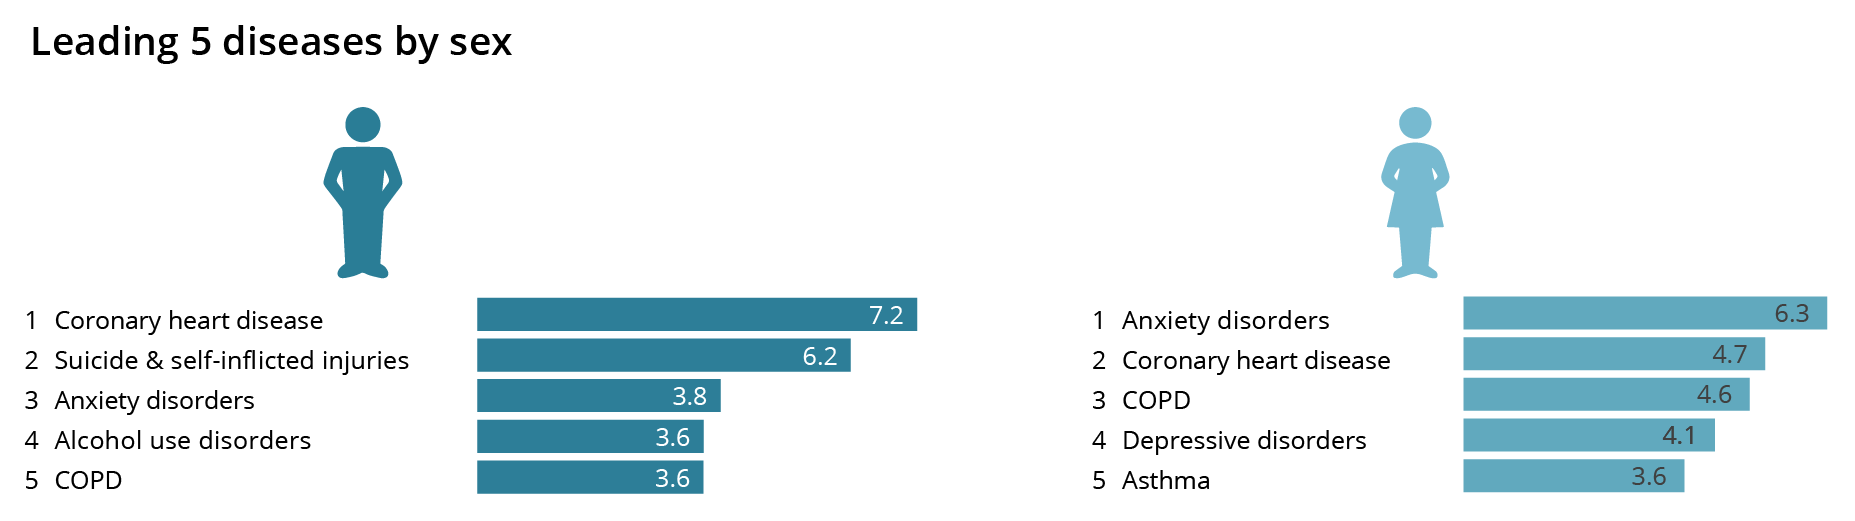
In 2022, the leading specific causes of total burden among First Nations males were coronary heart disease, suicide & self-inflicted injuries, and anxiety disorders. Among First Nations females, the leading specific causes were anxiety disorders, coronary heart disease, and COPD (Figure 7).
Figure 7: Leading causes of total burden and proportion (%) of total burden by sex, First Nations people, 2022
Source: AIHW First Nations Burden of Disease Database
First Nations males experienced higher rates of total burden due to suicide & self-inflicted injuries (2.9 times), poisoning (such as the toxic effects of medicinal or other substances) (2.1 times), drug use disorders (1.9 times), coronary heart disease and alcohol use disorders (each 1.7 times) compared with First Nations females. First Nations females experienced higher rates of total burden from osteoarthritis (1.8 times), anxiety disorders (1.5 times), asthma (1.4 times), rheumatoid arthritis and depressive disorders (each 1.3 times) compared with First Nations males.
To further explore the leading specific causes of total burden, see Dashboard 4: Leading causes of disease burden. This visualisation shows the top 20 contributors to total, fatal and non-fatal burden based on age-standardised rates in 2011, 2018 and 2022 for males, females and persons, and how this has changed over time.
Differences in burden by age
Burden affects First Nations people differently at various stages of life. This is partly due to the different diseases that have an impact at different ages, and partly due to the different causes of death and patterns of age at death for First Nations people.
In 2022, the rate of burden (number of DALY per 1,000 people) increased with age from early childhood. The rate of burden was higher in the under 5 age group than among older children due to the relatively large fatal burden resulting from deaths in infancy.
For infants and children aged under 5, nearly three-quarters (70%) of the burden was due to premature death (fatal burden). Among children aged 5–14, most of the burden (84%) was due to living with illness (non-fatal burden). For people aged 15–44, around two-thirds (64%) of burden was due to non-fatal burden. For people aged 45 and over, almost two-thirds (62%) of the total burden was due to fatal burden (Figure 8).
Figure 8: Fatal (YLL) and non-fatal (YLD) composition of the total burden (DALY) for First Nations people, by age group, 2022

Source: AIHW First Nations Burden of Disease Database
Differences in disease group burden by age
First Nations people experience health loss from different diseases and injuries at various stages of life (Figure 9).
In infancy and young childhood (aged under 5), infant & congenital conditions, such as pre-term birth & low birthweight complications, birth trauma & asphyxia and SIDS, were responsible for just over half (52%) of the burden. Injuries accounted for a further 12% of the total burden in this age group.
Mental health conditions & substance use disorders and injuries (including suicide) were the main causes of burden for late childhood, adolescence and adulthood from ages 5 to 44.
Cardiovascular diseases and cancers started to emerge as major causes of burden from around age 45, and continued to contribute substantially to disease burden in older First Nations people.
Respiratory diseases affected all age groups, accounting for between 2.5% and 13% of total burden across age groups. Musculoskeletal conditions affected all age groups from age 5, accounting for between 3.1% and 9.1% of total burden in First Nations people across age groups.
Figure 9: Relative proportion of total burden (DALY), by disease group and age group, First Nations people, 2022

Source: AIHW First Nations Burden of Disease Database
To further explore the contribution of disease burden by age, see Dashboard 1: Burden of disease in Australia and Dashboard 2: Fatal vs. non-fatal burden.