Gap in disease burden
On this page In this section
Key findings How big is the gap in disease burden? How does the gap vary by age and sex? Which disease groups contributed the most to the gap? Disease group contribution to fatal and non-fatal gap Disease group contribution to the gap by sex Contribution to the gap by age How does disease group contribution to the gap vary across the stages of life? Which specific diseases and injuries contribute most to the gap? Gap in burden has narrowed over time Excess burdenKey findings
- In 2022, after taking into account differences in age structure, First Nations people experienced overall burden (DALY) from disease and injury at 2.1 times the rate of non-Indigenous Australians.
- Dying early caused more of the gap than living with poor health. First Nations people were 2.4 times as likely as non-Indigenous Australians to die early (YLL), and 1.9 times as likely to live with poor health (YLD).
- In all age groups, First Nations people had higher rates of burden than non-Indigenous Australians. The largest relative differences were for people aged between 30 and 54, where DALY rates for First Nations people were between 2.5 and 2.8 times those for non-Indigenous Australians.
- The largest contributors to the gap in disease burden between First Nations people and non-Indigenous Australians (based on age-standardised DALY rate differences) were cardiovascular diseases (contributing 15.1% of the gap), mental health conditions & substance use disorders (15.0%), and injuries (11.7%).
- For non-fatal burden, mental health conditions & substance use disorders, respiratory diseases, and hearing & vision disorders were the largest contributors to the gap between First Nations people and non-Indigenous Australians, together contributing 61% of the total gap in YLD in 2022.
- For fatal burden, cardiovascular diseases, cancer & other neoplasms, and injuries were the leading disease groups contributing to the gap between First Nations people and non-Indigenous Australians, together responsible for more than half (57%) of the total gap in YLL in 2022.
- After removing differences in population size and age structure, the absolute gap in burden (DALY rate difference) between First Nations people and non-Indigenous Australians decreased by 8.8% between 2011 and 2022, from 249 to 227 per 1,000 people. There was a small drop in the relative gap, from a rate ratio of 2.2 in 2011 to 2.1 in 2022.
- Changes in the absolute gap in burden (DALY rate difference) between First Nations people and non-Indigenous were driven by a larger proportional decrease in the rate of total burden for First Nations people (6.3% decrease, from 457 to 429 DALY per 1,000 people) than for non-Indigenous Australians (3.2% decrease, from 208 to 202 per 1,000 people) between 2011 and 2022.
- Over the period 2011 to 2022, the largest decreases in the absolute gap were observed for cardiovascular diseases (decline in the DALY rate difference of 13 per 1,000 people), musculoskeletal conditions (decline of 7.2 DALY per 1,000) and endocrine disorders (decline of 6.8 DALY per 1,000).
- In 2022, 54% of the total burden experienced by First Nations people was considered excess burden (172,639 DALY). More of this excess was from fatal burden (99,033 YLL) compared with non-fatal burden (73,606 YLD).
Measuring the ‘gap’ in disease burden between First Nations people and non-Indigenous Australians is of key interest to current policy makers, as reflected in the National Agreement on Closing the Gap’s socioeconomic outcome target to close the gap in life expectancy within a generation (Joint Council on Closing the Gap 2020).
Apart from results for specific age groups, First Nations and non-Indigenous rates presented in this section have been age-standardised in order to remove the effect of differences in age structure between the 2 populations. Rate ratios and rate differences are presented as measures of the gap in disease burden. In addition, results are presented on the disease groups and specific diseases contributing most to the health gap (measured as the proportion that each disease group or specific disease contributes to the total DALY rate difference).
To explore data on the gap in disease burden between First Nations people and non-Indigenous Australians, see the following data visualisations:
- Dashboards 6a and 6b: Gap in health outcomes. These visualisations present the contribution of disease groups to the gap, by year, age and sex. They also show the DALY rate ratios and rate differences by disease group.
Direct age-standardisation was used to compare rates between First Nations people and non-Indigenous Australians, and to measure the gap in burden between the 2 populations. The direct method was chosen, following a series of sensitivity analyses previously undertaken by the AIHW, which looked at the impact and robustness of using the direct method compared with the indirect method on resulting YLL estimates for First Nations people (see AIHW 2015 for more information). The direct method enables multiple comparisons (for example, disease by sex) and can be used for comparisons over time. A limitation of the direct method is that less reliable estimates can be produced when it is applied to a small number of deaths and prevalent cases (AIHW 2011); this should be kept in mind when interpreting gap results for less common diseases and conditions.
Age-standardised rate differences and rate ratios are used in this report as measures of the gap. Rate differences (calculated as the First Nations rate minus the non-Indigenous rate) provide a measure of the absolute gap between 2 populations, while rate ratios (calculated as the First Nations rate divided by the non-Indigenous rate) are a measure of the relative gap between 2 populations.
For the most accurate estimate of the gap in disease burden between First Nations people and non-Indigenous Australians, comparisons have been made to estimates calculated for the non-Indigenous population. These estimates should not be added together to estimate burden in the total Australian population. Refer to the Australian Burden of Disease Study 2024 for burden of disease estimates for the total Australian population.
How big is the gap in disease burden?
In 2022, after taking into account differences in age structure, First Nations people experienced overall burden from disease and injury at 2.1 times the rate of non-Indigenous Australians. First Nations people experienced non-fatal burden at just under twice the rate of non-Indigenous Australians (YLD rate ratio of 1.9), and fatal burden at 2.4 times the rate for non-Indigenous Australians (Table 1).
Burden type and sex | First Nations rate per 1,000 | Non-Indigenous rate per 1,000 | Rate ratio | Rate difference |
|---|---|---|---|---|
Total burden (DALY) | - | - | - | - |
Males | 461.4 | 219.6 | 2.1 | 241.8 |
Females | 398.0 | 184.9 | 2.2 | 213.1 |
People | 428.8 | 201.6 | 2.1 | 227.2 |
Non-fatal burden (YLD) | - | - | - | - |
Males | 190.6 | 101.0 | 1.9 | 89.7 |
Females | 200.0 | 108.4 | 1.8 | 91.6 |
People | 195.5 | 104.8 | 1.9 | 90.7 |
Fatal burden (YLL) | - | - | - | - |
Males | 270.8 | 118.6 | 2.3 | 152.2 |
Females | 198.0 | 76.5 | 2.6 | 121.5 |
People | 233.3 | 96.8 | 2.4 | 136.5 |
Notes
- Rates were age-standardised to the 2001 Australian Standard population.
- Rate ratios and rate differences were calculated using unrounded rates and may differ from those calculated using the rounded rates presented in the table.
Source: AIHW First Nations Burden of Disease Database
How does the gap vary by age and sex?
The relative gap in total disease burden was slightly larger for First Nations females than males (DALY rate ratios of 2.2 and 2.1, respectively), but the absolute gap was greater for males than females (DALY rate differences of 242 per 1,000 people compared with 213 per 1,000) (Table 1).
In all age groups, First Nations people had higher rates of DALY than non-Indigenous Australians (Figure 1). The largest relative differences were for people aged between 30 and 54, where DALY rates for First Nations people were between 2.5 and 2.8 times those for non-Indigenous Australians.
Figure 1: Age-specific total burden rates (DALY per 1,000 people) and rate ratios, by age group, by Indigenous status, 2022
Grouped column chart showing both absolute and relative difference by Indigenous status. Across all age groups, First Nations people experience higher rates of burden than non-Indigenous people.
Source: AIHW First Nations Burden of Disease Database
Which disease groups contributed the most to the gap?
In 2022, across all disease groups, First Nations people experienced a higher rate of burden than non-Indigenous Australians, with the exception of reproductive & maternal conditions, for which rates were similar (ratio of 0.9) (Figure 2). The largest contributors to the gap in disease burden between First Nations people and non-Indigenous Australians (based on age-standardised DALY rate differences) were:
- cardiovascular diseases (contributing 15.1% of the gap)
- mental health conditions & substance use disorders (15.0%)
- injuries (11.7%)
- respiratory diseases (11.0%)
- cancer & other neoplasms (10.7%) (Figure 3).
These 5 disease groups were responsible for almost two-thirds (63%) of the gap in disease burden between First Nations people and non-Indigenous Australians.
Figure 2: Gap (rate ratio and rate difference) in total burden, by disease group, 2022
Combined column chart showing the gap (rate ratio and rate difference) in total burden by disease group. The largest rate ratio was for kidney & urinary diseases and the largest rate difference was for cardiovascular diseases.
Source: AIHW First Nations Burden of Disease Database
Disease groups that showed the greatest relative differences (rate ratios) in disease burden between First Nations people and non-Indigenous Australians (based on age-standardised DALY rate ratios) were:
- kidney & urinary diseases – rate ratio of 4.9
- hearing & vision disorders – rate ratio of 3.6
- endocrine disorders (including diabetes) – rate ratio of 3.6 (Figure 2).
While these rate ratios were much higher than those for mental health conditions & substance use disorders (ratio of 2.1), cardiovascular diseases (2.5) and injuries (2.6), their contribution to the total health gap was lower (5.8% for endocrine disorders, 4.3% for kidney & urinary diseases and 4.0% for hearing & vision disorders).
Disease group contribution to fatal and non-fatal gap
The disease groups contributing most to the gap between First Nations people and non-Indigenous Australians were different for fatal and non-fatal burden (Figure 3). When looking at non-fatal burden, mental health conditions & substance use disorders, respiratory diseases, and hearing & vision disorders were the largest contributors to the gap between First Nations people and non-Indigenous Australians, together contributing 60% of the total gap in YLD in 2022.
In contrast, for fatal burden, cardiovascular diseases, cancer & other neoplasms, and injuries were the leading disease groups contributing to the gap between First Nations people and non-Indigenous Australians, together responsible for more than half (57%) of the total gap in YLL in 2022.
Figure 3: Percentage contribution (% of rate difference) of disease groups to the gap in total (DALY), non-fatal (YLD) and fatal (YLL) burden, 2022
Stacked bar chart showing proportional contribution of disease groups to the gap by type of burden. For DALY and YLL, cardiovascular was the largest contributor. For YLD, it was mental health conditions and substance disorders use.
Note: Per cent labels are not shown for disease groups contributing less than 3% of the gap.
Source: AIHW First Nations Burden of Disease Database
Disease group contribution to the gap by sex
For First Nations males, the largest contributors to the gap in total disease burden were:
- cardiovascular diseases (accounting for 16% of the gap)
- mental health conditions & substance use disorders (15%)
- injuries (15%) (Figure 4).
For First Nations females, the largest contributors to the gap in total disease burden were:
- mental health conditions & substance use disorders (accounting for 15% of the gap)
- cardiovascular diseases (14%)
- respiratory diseases (12%) (Figure 4).
Figure 4: Percentage contribution (% of rate difference) of disease groups to the gap in total disease burden (DALY), by sex, 2022
Stacked bar chart showing proportional contribution of diseases groups to the gap in DALY, by sex. For males, the largest contributor was cardiovascular diseases, while for females, it was mental health conditions and substance disorders use.
Note: Per cent labels are not shown for disease groups contributing less than 3% of the gap.
Source: AIHW First Nations Burden of Disease Database
Despite these disease groups being the largest contributors to the gap in total disease burden for males and females, they were not the disease groups with the highest relative differences (rate ratios) in overall disease burden between First Nations people and non-Indigenous Australians.
For First Nations males, the disease groups with the highest relative differences in overall disease burden between First Nations people and non-Indigenous Australians were:
- kidney & urinary diseases (3.7 times the rate of non-Indigenous males)
- hearing & vision disorders (3.4 times)
- blood & metabolic disorders (3.2 times).
For First Nations females, the disease groups with the highest relative differences in overall disease burden between First Nations people and non-Indigenous Australians were:
- kidney & urinary diseases (6.9 times the rate of non-Indigenous females)
- endocrine disorders (including diabetes) (4.3 times)
- hearing & vision disorders (3.8 times).
Contribution to the gap by age
The contribution of different age groups to the overall gap in total disease burden between First Nations people and non-Indigenous Australians varies. One-third of the overall gap (33%) was due to differences in burden among people aged 45–64, with a further quarter (27%) due to differences in burden among people aged 25–44. Differences in burden between First Nations and non-Indigenous children and adolescents aged 5–14 made the smallest contribution to the overall gap (1.7%) (Table 2).
Age group | First Nations rate per 1,000 | Non-Indigenous rate per 1,000 | Rate difference | Rate ratio | Per cent contribution to the gap |
|---|---|---|---|---|---|
0–4 | 169.4 | 79.7 | 89.7 | 2.1 | 2.6 |
5–14 | 71.9 | 44.7 | 27.2 | 1.6 | 1.7 |
15–24 | 198.1 | 105.2 | 92.9 | 1.9 | 5.7 |
25–44 | 326.6 | 131.3 | 195.3 | 2.5 | 27.4 |
45–64 | 554.0 | 234.8 | 319.2 | 2.4 | 32.9 |
65–74 | 902.3 | 431.6 | 470.7 | 2.1 | 14.4 |
75+ | 1,502.0 | 981.5 | 520.5 | 1.5 | 15.3 |
Total(a) | 428.8 | 201.6 | 227.2 | 2.1 | 100.0 |
(a) Total rates were age-standardised to the 2001 Australian Standard population.
Source: AIHW First Nations Burden of Disease Database
How does disease group contribution to the gap vary across the stages of life?
The contribution of different disease groups to the gap in total disease burden between First Nations people and non-Indigenous Australians varies by age (Figure 5).
- For infants and children aged under 5, infant & congenital conditions was the largest disease group contributor to the gap (representing 43% of the gap among children under 5).
- Mental health conditions & substance use disorders was the largest disease group contributor to the gap for children aged 5–14, young people aged 15–24 and adults aged 25–44 (representing 44%, 45% and 33% of the gap in these age groups, respectively).
- Injuries was the second or third largest contributor to the gap in each of the age groups below age 45, representing between 16% and 33% of the gap.
- Cardiovascular diseases was the third largest contributor to the gap in adults aged 25–44 (representing 11% of the gap in this age group) and the leading contributor to the gap in adults aged 45–64 (20% of the gap in this age group).
- Cancer & other neoplasms was the second largest contributor to the gap in adults aged 45–64 and 75 and over (representing 15% and 16% of the gap in each age group, respectively) and the leading contributor to the gap in adults aged 65–74 (21% of the gap in this age group).
- Respiratory diseases was the third largest contributor to the gap in adults aged 45–64 and 65–74, and the leading contributor to the gap in older adults aged 75 and over (representing 22% of the gap in this age group).
For further information on the impact of the burden of disease on First Nations people by age, see Burden across life stages.
Figure 5: Percentage contribution (%) to the health gap (based on DALY rate difference) between First Nations people and non-Indigenous Australians, by age and disease group, 2022
Stacked bar chart showing proportional contribution to the health gap (based on DALY difference), by age and disease group. The contribution of different disease groups to the gap in total disease burden vary by age.
Source: AIHW First Nations Burden of Disease Database
Which specific diseases and injuries contribute most to the gap?
Table 3 presents the top 5 specific causes contributing to the gap in total burden for First Nations males and females in 2022; together they accounted for over about one-third of the gap (33% for males and 31% for females). For information on how specific causes are classified under each disease group see Australian Burden of Disease Study: Methods and supplementary material 2018, Disease specific methods - morbidity.
For males in 2022, the specific causes that were leading contributors to the gap in total burden between First Nations people and non-Indigenous Australians were:
- coronary heart disease (CHD) (accounting for 10% of the gap for males)
- chronic obstructive pulmonary disease (COPD) (7.5% of the gap)
- suicide & self-inflicted injuries (5.6% of the gap).
For females in 2022, the specific causes that were leading contributor to the gap in total burden between First Nations people and non-Indigenous Australians were:
- COPD (accounting for 8.6% of the gap for females)
- CHD (7.6% of the gap)
- Type 2 diabetes (5.9% of the gap).
Sex and leading specific diseases | First Nations rate per 1,000 | Non-Indigenous rate per 1,000 | Rate ratio | Rate difference | Gap contribution (percent) |
|---|---|---|---|---|---|
Males | - | - | - | - | - |
Coronary heart disease | 41.6 | 16.3 | 2.6 | 25.3 | 10.5 |
COPD | 24.3 | 6.1 | 4.0 | 18.1 | 7.5 |
Suicide & self-inflicted injuries | 21.6 | 8.1 | 2.7 | 13.5 | 5.6 |
Type 2 diabetes | 17.0 | 5.0 | 3.4 | 12.0 | 5.0 |
Alcohol use disorders | 13.7 | 3.7 | 3.7 | 10.1 | 4.2 |
Females | - | - | - | - | - |
COPD | 24.1 | 5.8 | 4.1 | 18.2 | 8.6 |
Coronary heart disease | 23.0 | 6.7 | 3.4 | 16.3 | 7.6 |
Type 2 diabetes | 15.6 | 3.1 | 5.0 | 12.5 | 5.9 |
Chronic kidney disease | 12.2 | 1.7 | 7.1 | 10.5 | 4.9 |
Lung cancer | 13.6 | 4.4 | 3.1 | 9.1 | 4.3 |
Source: AIHW First Nations Burden of Disease Database
Gap in burden has narrowed over time
After removing differences in population size and age structure, the absolute gap in burden (DALY rate difference) between First Nations people and non-Indigenous Australians decreased by 8.8% between 2011 and 2022, from 249 to 227 per 1,000 people. There was a small drop in the relative gap, from a rate ratio of 2.2 in 2011 to 2.1 in 2022. This was largely driven by a narrowing of the gap for fatal burden, which decreased by 9.8% between 2011 and 2022. The gap in non-fatal burden also decreased during this period, by 7.4% (Figure 6). There was no change in the relative gap for fatal burden (a rate ratio of 2.4 in 2011 and 2022), while there was a slight drop for non-fatal burden (from a rate ratio of 2.0 in 2011 to 1.9 in 2022).
Figure 6: Change between 2011 and 2022 in the gap in age-standardised total (DALY), fatal (YLL), and non-fatal (YLD) burden rate (per 1,000 people) between First Nations people and non-Indigenous Australians

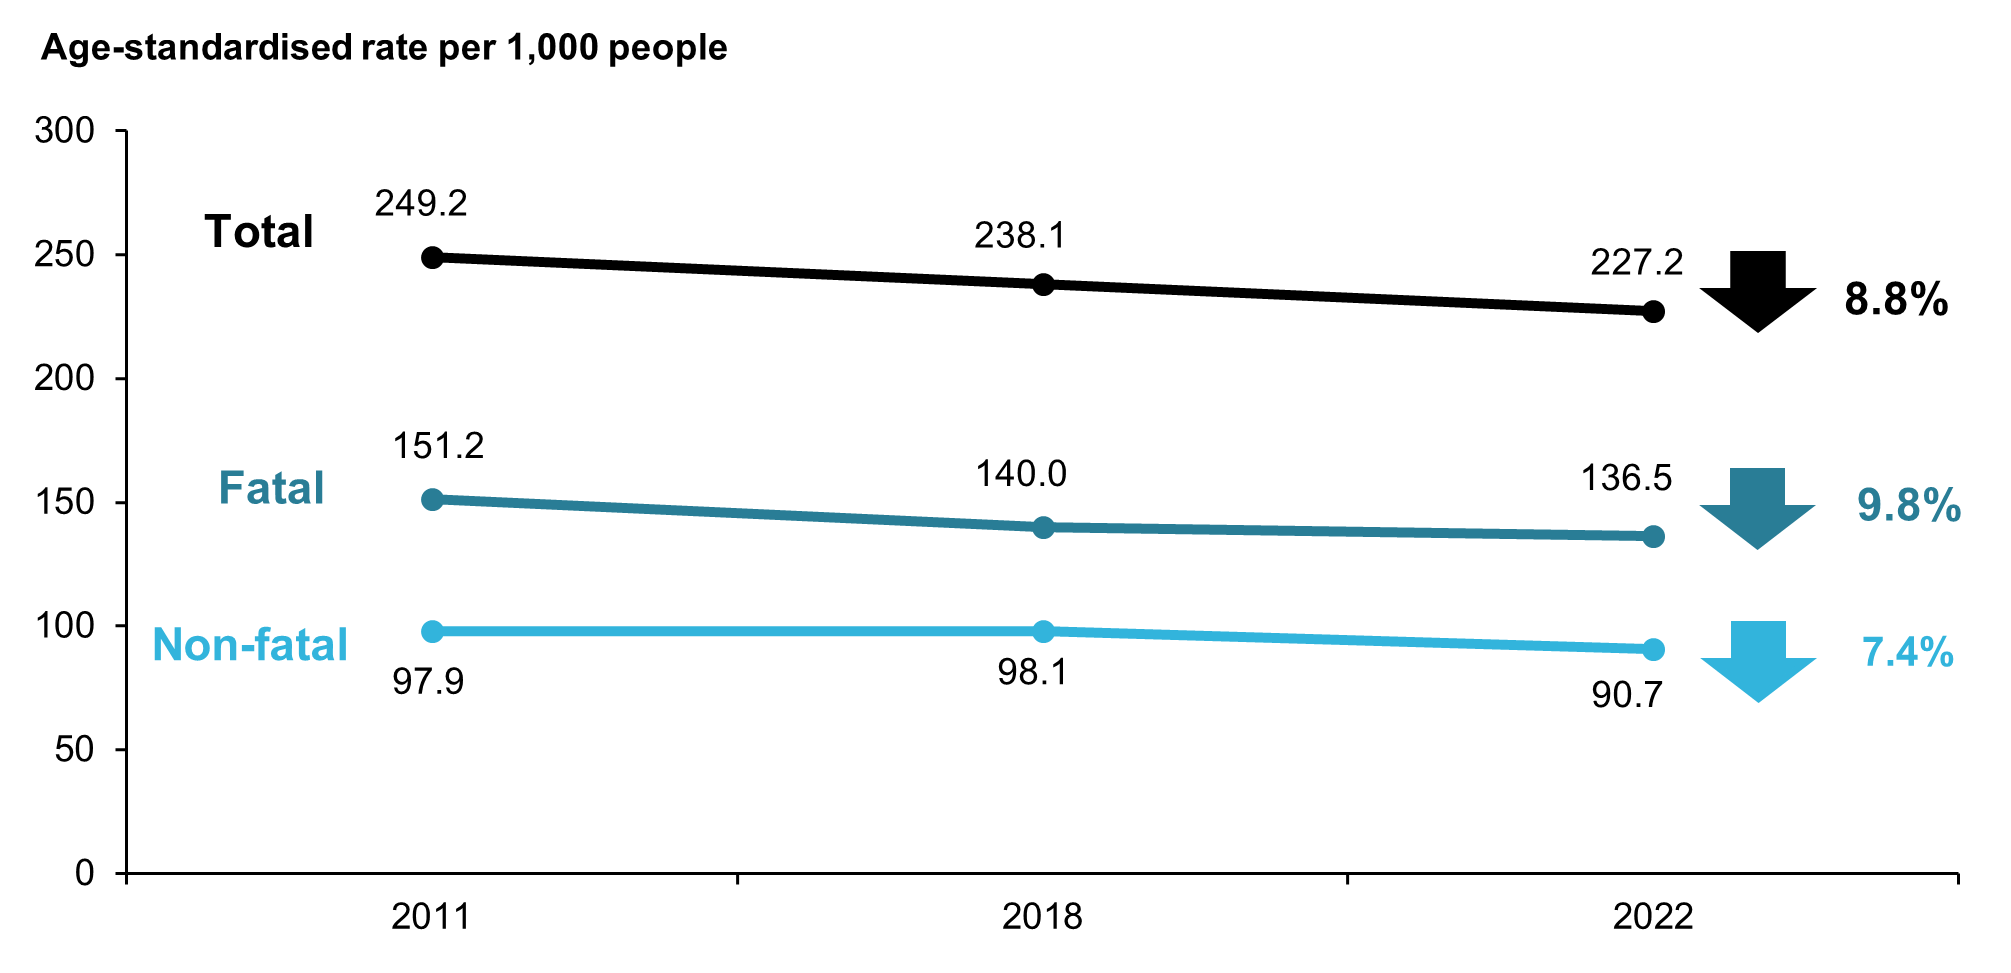
Note: Rates were age-standardised to the 2001 Australian Standard population.
Source: AIHW First Nations Burden of Disease Database
Change in the absolute gap in burden (DALY rate difference) was driven by a larger proportional decrease in the rate of total burden for First Nations people (6.3% decrease, from 457 to 429 DALY per 1,000 people) than for non-Indigenous Australians (3.2% decrease, from 208 to 202 per 1,000 people) between 2011 and 2022 (Figure 7).
For fatal burden, there were similar proportional declines in the age-standardised rate for First Nations people (11% decrease, from 262 to 233 YLL per 1,000 people) and non-Indigenous Australians (12% decrease, from 111 to 97 YLL per 1,000 people) (Figure 7).
For non-fatal burden, there was no substantial change in the age-standardised rate for First Nations people between 2011 and 2022 (0.1% decrease) but the rate for non-Indigenous Australians increased (7.3% increase, from 98 to 105 YLD per 1,000 people) over the same period (Figure 7).
Figure 7: Change between 2011 and 2022 in the age-standardised total (DALY), non-fatal (YLD), and fatal (YLL) burden rate (per 1,000 people), First Nations people and non-Indigenous Australians
Line graph showing change in age-standardised burden rates over between 2011 and 2022 for First Nations people and non-Indigenous Australians, by type of burden, sex and disease group. There was a larger proportional decrease in the rate of total burden for First Nations people than non-Indigenous people.
Note:
- Rates were age-standardised to the 2001 Australian Standard population.
- For the oral disease group, the YLL rate is based on a small number of First Nations deaths so this result should be used with caution.
- For the hearing & vision disorders disease group there was no fatal burden, and as such the YLL ASR rate is zero.
Source: AIHW First Nations Burden of Disease Database
Changes in the gap by sex
There were greater decreases in the gap in total disease burden, non-fatal burden and fatal burden for males than females between 2011 and 2022: a 12% decrease in the DALY gap for males compared with a 5.8% decrease for females; an 11% decline in the YLD gap for males compared with a 4.7% decline for females; and a 13% decline in the YLL gap for males compared with an 6.6% decline for females.
Changes in the gap by disease group
Over the period 2011 to 2022, there was a decrease in the gap between First Nations people and non-Indigenous Australians for almost half (8) of the 17 disease groups, as measured by the DALY rate differences.
The largest decreases in the absolute gap were observed for:
- cardiovascular diseases - decline in the DALY rate difference of 13 per 1,000 people, or 27%
- musculoskeletal conditions - decline of 7.2 DALY per 1,000, 50%
- endocrine disorders - decline of 6.8 DALY per 1,000, 34%.
There were also decreases in the relative gap as measured by rate ratios for musculoskeletal conditions (from 1.6 to 1.3) and endocrine disorders (from 4.7 to 3.6). For cardiovascular diseases the rate ratio remained the same, at 2.5.
The largest increases in the absolute gap were observed for:
- infectious diseases - increase in the DALY rate difference of 3.4 per 1,000, or 43%
- cancer & other neoplasms - increase of 2.9 DALY per 1,000, 13%
- respiratory diseases - increase of 2.0 DALY per 1,000, 8.7%.
There were also increases in the relative gap for cancer & other neoplasms (from 1.5 to 1.7) and respiratory diseases (from 2.6 to 2.9), but for infectious diseases the rate ratio declined (from 3.2 to 2.3).
Changes in contribution to the gap by disease group
The same 6 disease groups were the greatest contributors to the gap in total burden in both 2011 and 2022, accounting for almost 70% of the gap. Cardiovascular diseases was the leading contributor in both years, though its contribution decreased from 19% to 15%. The contribution of endocrine disorders also decreased slightly. The contributions made by the other 4 disease groups increased (Figure 8).
Figure 8: Percentage contribution (%) of disease groups to the gap in total disease burden between First Nations people and non-Indigenous Australians (based on DALY rate differences), 2011 and 2022
Stacked bar chart showing proportional contribution of disease groups to the gap (based on DALY rate difference) between 2011 and 2022. The top five causes remained the same between years and their contribution increased for all causes, except cardiovascular diseases.
Source: AIHW First Nations Burden of Disease Database
Excess burden
‘Excess’ burden is an additional measure that can be used to consider the difference in burden experienced between First Nations people and non-Indigenous Australians. Excess burden presented here is the burden that would have been avoided if First Nations people experienced the same rate of burden as non-Indigenous Australians.
Definition and example of how excess burden is calculated
excess burden: The reduction that would occur in overall disease burden if all groups had the same rate of burden as the least burdened group.
For example:
If the rate of burden for a disease was 10 DALY per 1,000 people in population A and 15 DALY per 1,000 people in population B then some of the burden experienced by population B would be considered excess when compared with population A.
If we assume population B consists of 3,000 people, then the disease burden in population B is 45 DALY (15/1,000 x 3,000 = 45 DALY). The excess burden in population B is calculated as the difference between the expected burden if population B experienced the same rate of burden as population A, and the actual burden experienced by population B (45 DALY).
The expected burden for population B is 30 DALY (10/1,000 x 3,000 = 30 DALY) and therefore the excess burden in population B is 15 DALY (45 – 30 = 15 DALY). This can also be described as 33% of the burden in population B is considered to be excess burden (15/45*100 = 33%).
In 2022, 54% of the total burden experienced by First Nations people was considered excess burden (172,639 DALY). More of this excess was from fatal burden (99,033 YLL) compared with non-fatal burden (73,606 YLD). The proportion of the total burden considered to be excess decreased between 2011 and 2022 (from 57% to 54%), driven by a larger reduction in excess non-fatal burden (Table 4).
Excess burden type | 2011 | 2018 | 2022 |
|---|---|---|---|
Total burden (DALY) | - | - | - |
DALY | 199,800 | 273,195 | 317,333 |
Expected DALY | 85,770 | 117,960 | 144,694 |
Excess DALY | 114,031 | 155,235 | 172,639 |
Excess DALY % | 57.1 | 56.8 | 54.4 |
Non-fatal burden (YLD) | - | - | - |
YLD | 95,752 | 136,578 | 158,944 |
Expected YLD | 47,643 | 67,661 | 85,338 |
Excess YLD | 48,109 | 68,917 | 73,606 |
Excess YLD % | 50.2 | 50.5 | 46.3 |
Fatal burden (YLL) | - | - | - |
YLL | 104,048 | 136,617 | 158,389 |
Expected YLL | 38,126 | 50,299 | 59,357 |
Excess YLL | 65,922 | 86,318 | 99,033 |
Excess YLL % | 63.4 | 63.2 | 62.5 |
Source: AIHW First Nations Burden of Disease Database
Disease group contribution to excess burden
In 2022, the disease groups that contributed the most excess burden to First Nations people were:
- mental health conditions & substance use disorders (19% of excess DALY, or 32,674 excess DALY)
- injuries (15%, or 25,756 excess DALY)
- cardiovascular diseases (13%, or 23,304 excess DALY) (Figure 9).
The disease groups that contributed the most excess burden varied between fatal (YLL) and non-fatal (YLD) burden, explore Figure 9 for more information.
Figure 9: Percentage contribution (%) of disease groups to excess total (DALY), excess non-fatal (YLD) and excess fatal (YLL) burden, First Nations people, 2022
Stacked bar chart showing proportional contribution of disease groups to excess burden, by burden type. For both DALY and YLD, mental health conditions and substance use disorders was the largest contributor to excess burden. For YLL, injuries was the largest contributor to excess YLL burden.
Source: AIHW First Nations Burden of Disease Database
Excess burden within disease groups
In 2022, among First Nations people, the amount of burden considered to be excess differed by disease group (Figure 10). Among the disease groups with the highest amounts of total burden (DALY) among First Nations people:
- about half (51%) of the burden due to mental health conditions & substance use disorders was considered to be excess burden (32,674 out of 64,147 DALY)
- almost two-thirds (64%) of the burden due to injuries was excess burden (25,756 out of 40,037 DALY)
- over two-thirds (67%) of the burden due to cardiovascular diseases was excess burden (23,304 out of 34,796 DALY).
Although not among the leading disease group contributors to total burden (DALY) for First Nations people in 2022, the disease groups with the highest proportional excess burden were:
- kidney & urinary diseases (84% of DALY in this disease group was considered to be excess, 6,021 out of 7,179 DALY)
- hearing & vision disorders (82% excess, 8,076 out of 9,862 DALY)
- endocrine disorders (74% excess, 8,650 out of 11,631 DALY).
These are the same disease groups shown to have the largest disparity in burden in terms of the relative gap between First Nations people and non-Indigenous Australians – see Figure 2 above.
Figure 10: Expected and excess fatal (YLL) and non-fatal (YLD) burden by type of burden and disease group, First Nations people, 2022
Stacked bar chart showing expected and excess YLL and YLD burden, by type of burden and disease group. Mental health conditions and substance use disorders had the largest number of excess YLD burden and injuries had the largest number of excess YLL burden.
Notes:
- Data for reproductive & maternal conditions not shown as there was no overall excess total (DALY) burden among First Nations people in 2022. This was due to lower rates of total (DALY) and non-fatal (YLD) burden among First Nations people compared with non-Indigenous Australians. Rates of fatal (YLL) burden for reproductive & maternal conditions were higher among First Nations people compared with non-Indigenous Australians, indicating excess fatal (YLL) burden.
- Due to lower rates of non-fatal (YLD) burden among First Nations people compared with non-Indigenous Australians there was no excess non-fatal (YLD) burden among First Nations people for cancer & other neoplasms.
Source: AIHW First Nations Burden of Disease Database
Contribution of fatal and non-fatal burden to excess burden
In 2022, over half of the total excess burden experienced by First Nations people was due to excess fatal burden (57%, 99,033 YLL out of 172,639 DALY) (Figure 11). Among the disease groups with the highest amounts of excess burden:
- almost all the excess total burden from mental health conditions & substance use disorders was non-fatal burden (97%, 31,750 YLD out of 32,674 DALY)
- most of the excess burden from injuries and cardiovascular diseases was fatal burden (90% and 88%, respectively).
Figure 11: Percentage contribution (%) of fatal (YLL) and non-fatal (YLD) to excess total burden (DALY) by disease group, First Nations people, 2022
Note: Data for reproductive & maternal conditions not shown due to small numbers.
Source: AIHW First Nations Burden of Disease Database
Top specific diseases contributing to excess burden
The top 5 specific diseases contributing to excess burden together accounted for over a quarter (28%) of the total excess burden for First Nations people in 2022 (Table 5). The specific diseases that were leading contributors to excess burden were:
- coronary heart disease (accounting for 7.9% of total excess burden, or 13,572 of 172,639 DALY)
- COPD (5.8% of excess burden, 9,983 excess DALY)
- suicide & self-inflicted injuries (5.4% of excess burden, 9,371 excess DALY)
- type 2 diabetes (4.6% of excess burden, 8,024 excess DALY)
- anxiety disorders (4.3% of excess burden, 7,360 excess DALY).
Causes | DALY | Expected DALY | Excess DALY | % of total excess DALY |
|---|---|---|---|---|
Coronary heart disease | 19,023 | 5,451 | 13,572 | 7.9 |
COPD | 12,776 | 2,793 | 9,983 | 5.8 |
Suicide & self-inflicted injuries | 14,421 | 5,050 | 9,371 | 5.4 |
Type 2 diabetes | 10,198 | 2,174 | 8,024 | 4.6 |
Anxiety disorders | 15,832 | 8,473 | 7,360 | 4.3 |
Leading 5 specific causes | 72,250 | 23,941 | 48,309 | 28.0 |
All other causes | 245,083 | 120,753 | 124,329 | 72.0 |
Total | 317,333 | 144,694 | 172,639 | 100.0 |
Source: AIHW First Nations Burden of Disease Database
Excess burden within individual diseases
In 2022, among First Nations people, the amount of burden considered to be excess differed for individual causes of burden. Causes with the highest proportional excess burden included:
- scabies (100% of DALY considered excess, 264 of 264 DALY)
- protein-energy deficiency (94% considered excess, 1,905 of 2,028 DALY)
- rheumatic heart disease (94% considered excess, 1,351 of 1,438 DALY)
- chronic kidney disease (87% considered excess, 5,887 of 6,783 DALY)
- hearing loss (84% considered excess, 6,740 of 8,029 DALY).
AIHW (Australian Institute of Health and Welfare) 2011. Principles on the use of direct age-standardisation in administrative data collections: For measuring the gap between Indigenous and non-Indigenous Australians. Cat. no. CSI 12. Canberra: AIHW.
AIHW 2015. Australian Burden of Disease Study: fatal burden of disease in Aboriginal and Torres Strait Islander people 2010. Cat. no. BOD 2. Canberra: AIHW.
Joint Council on Closing the Gap 2020. National Agreement on Closing the Gap.