Interactive data on disease burden
The following interactive data visualisations allow users to explore the data in more detail and filter/customise the data and figures to meet their information needs.
The AIHW aims to meet the Australian Government’s web accessibility requirements. If any of the interactive burden of disease pages are inaccessible to you, or you are experiencing problems accessing content for any reason, please contact us at [email protected].
What is included in the First Nations Burden of Disease Study 2022 data visualisations?
The interactive data visualisations present estimates of total burden (DALY), non-fatal burden (YLD), and fatal burden (YLL) for First Nations people in Australia for 2011, 2018 and 2022.
The following interactive data visualisations are included:
- Overview of disease burden, for all disease groups
- Contributions of fatal vs non-fatal burden to total burden for disease group
- Comparison of disease burden over time for a disease group
- Changes in the ranking of leading causes (specific disease/injury) of disease burden over time by sex
- Summary of disease burden for a specific disease or injury
- Gap in health outcomes
- Top disease groups across the stages of life
How to navigate the interactive visualisation
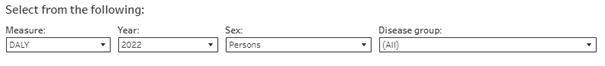
Use the drop-down list above each graph to view the data by options including measure of disease burden, year, sex and disease group.
Hover over the bars, line or coloured tiles on the charts for additional information.
The toolbar at the bottom of the data dashboards enables users to interact with the data in different ways:

Undo = Undo the filter
Redo = Redo the filter
Reset = Clears all filters and resets visualisation to defaults
Refresh = Refreshes the data
Pause = Pauses the data (filters do not work if this button is selected)
Share = Generates a link that can be shared (note that filters will not be applied when link is shared)
Download = Allows a downloadable file as either an image (PNG), PDF or PowerPoint file. This is a useful way to save snapshots of the data to include in a document or presentation.
Full screen = Displays the dashboard in full screen mode (press Esc to return to original view)