Summary

Living with illness or injury (non-fatal): 50% of total burden

Dying prematurely (fatal): 50% of total burden
Chronic diseases and injuries cause most of the burden
Out of the 17 disease groups, the disease groups that caused most of the total burden in 2022 were mental health conditions & substance use disorders, injuries, cardiovascular diseases, cancer & other neoplasms and respiratory diseases; together, these accounted for 62% of the total burden among First Nations people (Figure 1).
Figure 1: Proportion (%) of total burden, and fatal and non-fatal composition of total burden, by top 5 disease groups, First Nations people, 2022
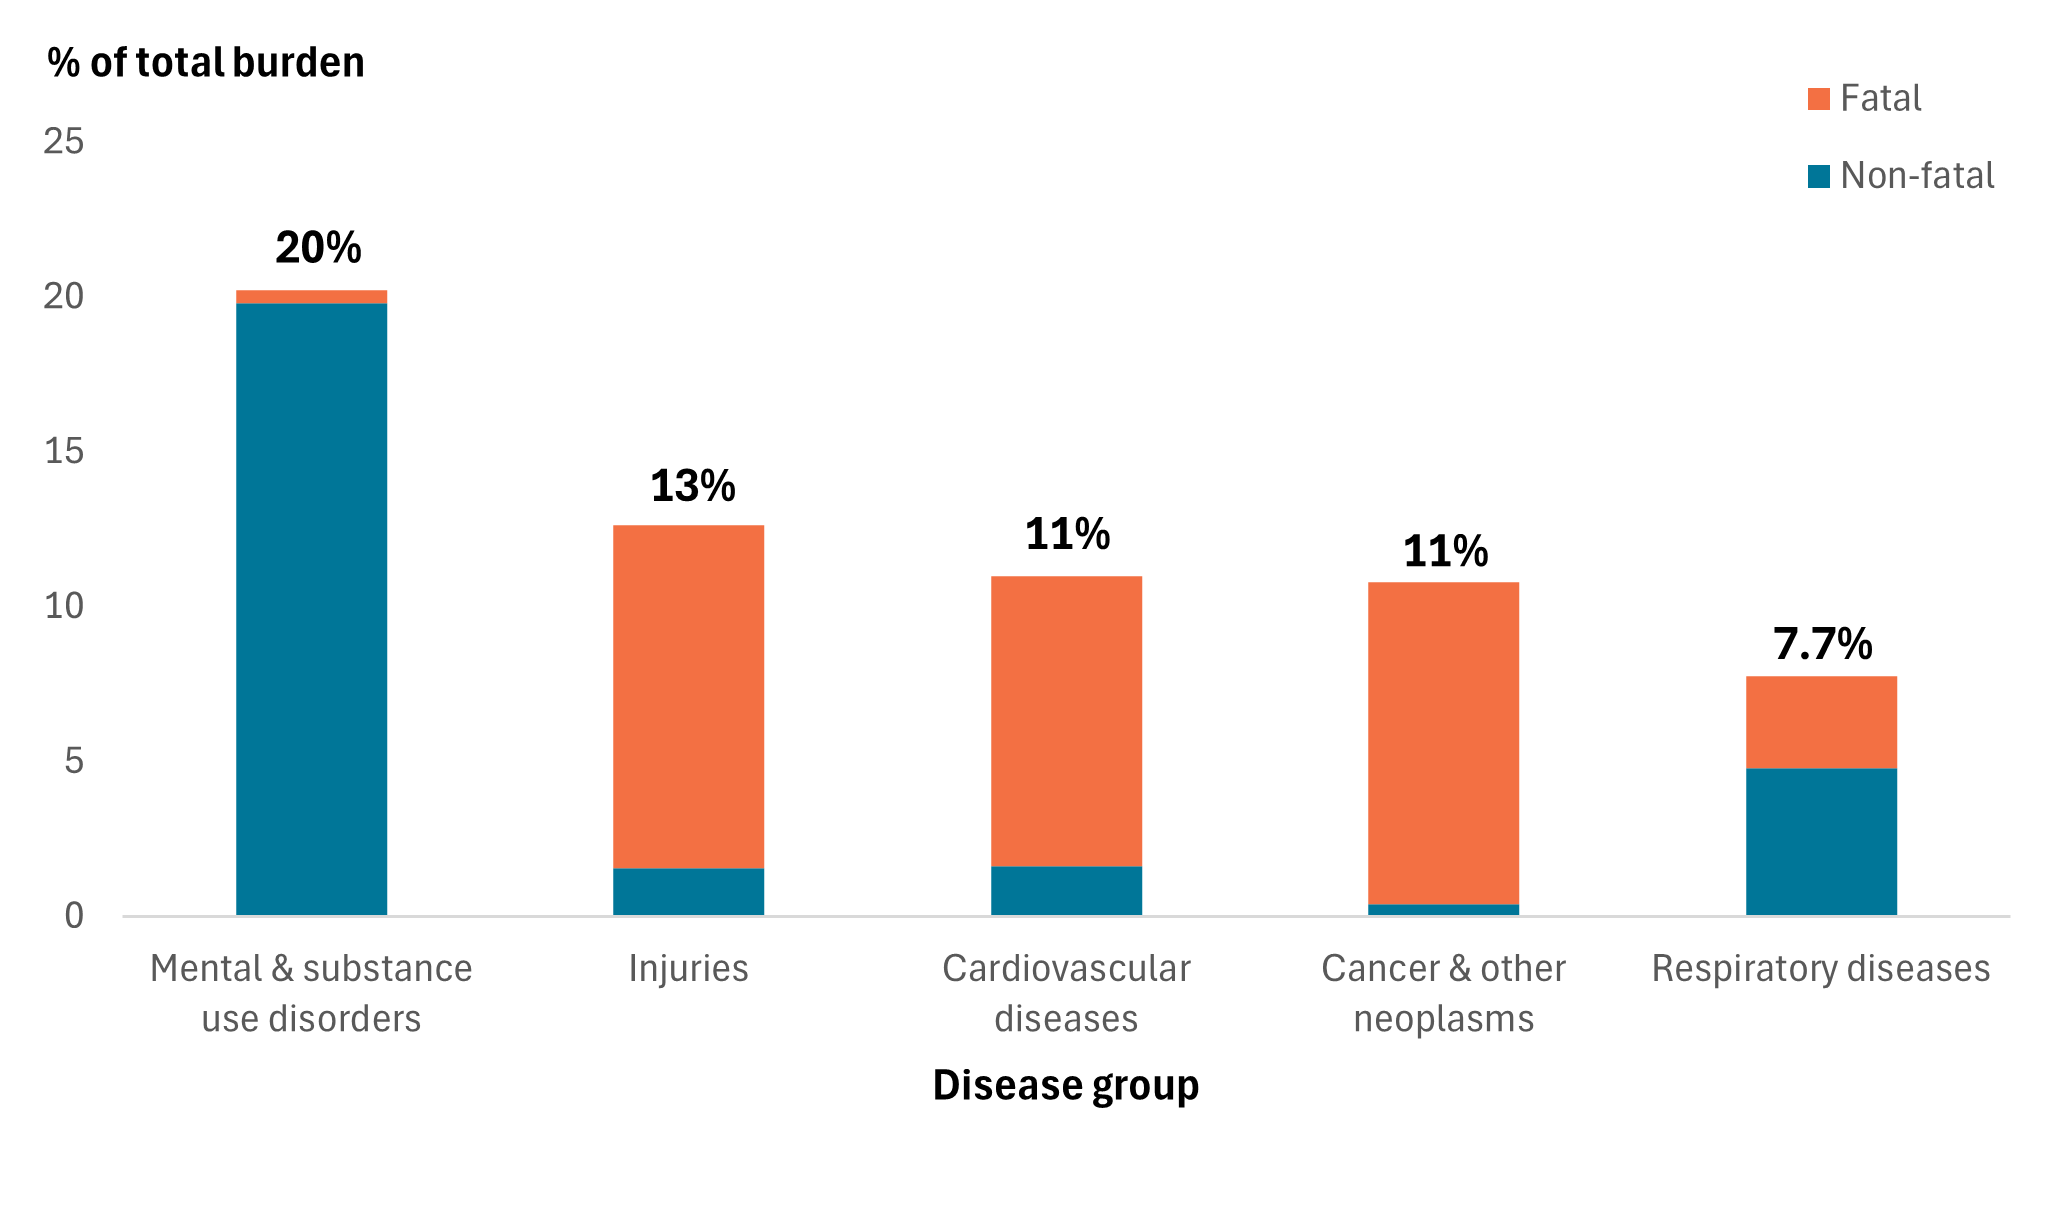
Source: AIHW First Nations Burden of Disease Database
Higher burden for males, particularly fatal burden
In 2022, dying from disease and injury accounted for more of the burden in males (54%), while living with illness accounted for more of the burden in females (55%) (Figure 2).
Top specific causes of the burden
The top 5 specific causes of burden for First Nations people in 2022 were:
- Coronary heart disease (6.0%)
- Anxiety disorders (5.0%)
- Suicide & self-inflicted injuries (4.5%)
- Chronic obstructive pulmonary disease (COPD) (4.0%)
- Depressive disorders (3.4%)
These 5 causes together accounted for 23% of the total burden.
Coronary heart disease, anxiety disorders and COPD were ranked in the top 5 diseases for both sexes; however, the proportion of burden that each contributed was different (Figure 4).
Figure 4: Leading causes of total burden and proportion (%) of total burden by sex, 2022
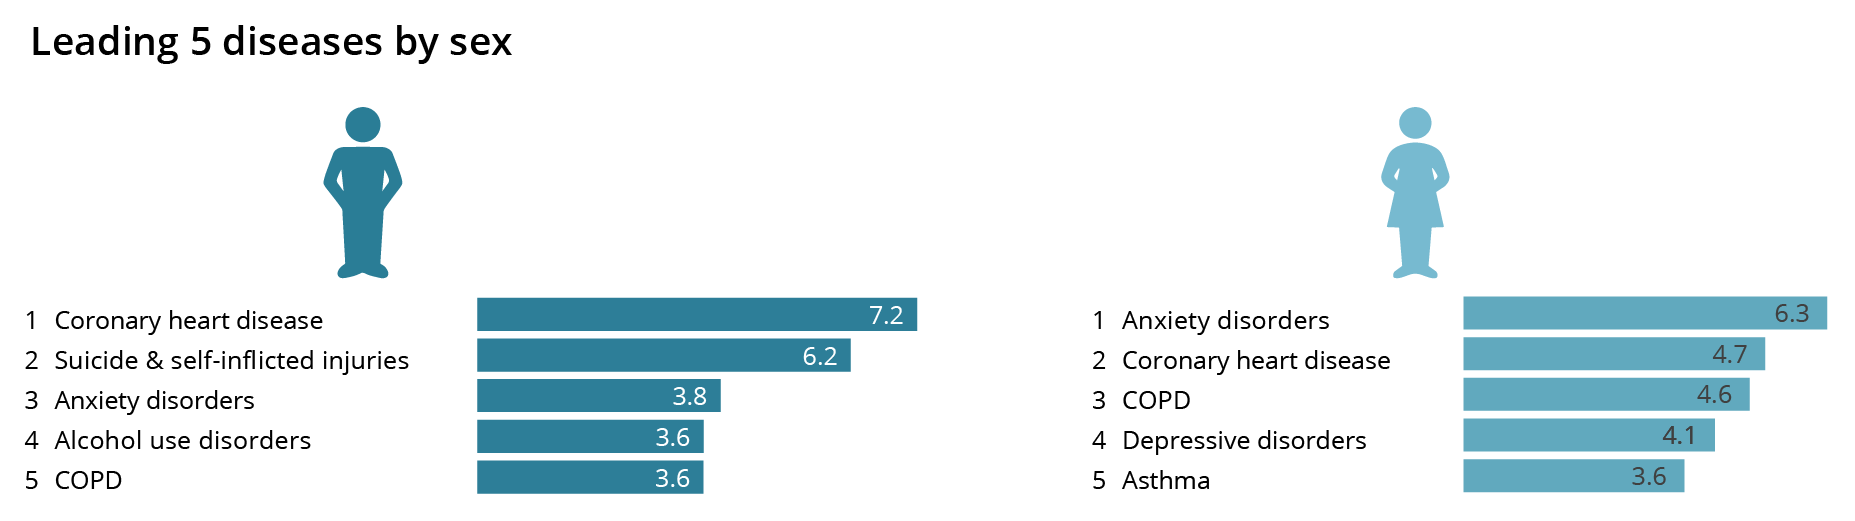
Source: AIHW First Nations Burden of Disease Database
Decline in premature deaths, but levels of illness and injury remain stable
Overall, the health of First Nations people has improved over the period from 2011 to 2022. After adjusting for population growth and ageing, there was a 6.3% decline in total burden – this decrease was driven by an 11% decline in fatal burden (Figure 5). Over the same period there was no substantial change in non-fatal burden.
Figure 5: Change between 2011 and 2022 in rates of total (DALY), fatal (YLL) and non-fatal (YLD) burden rate (per 1,000 people), First Nations people
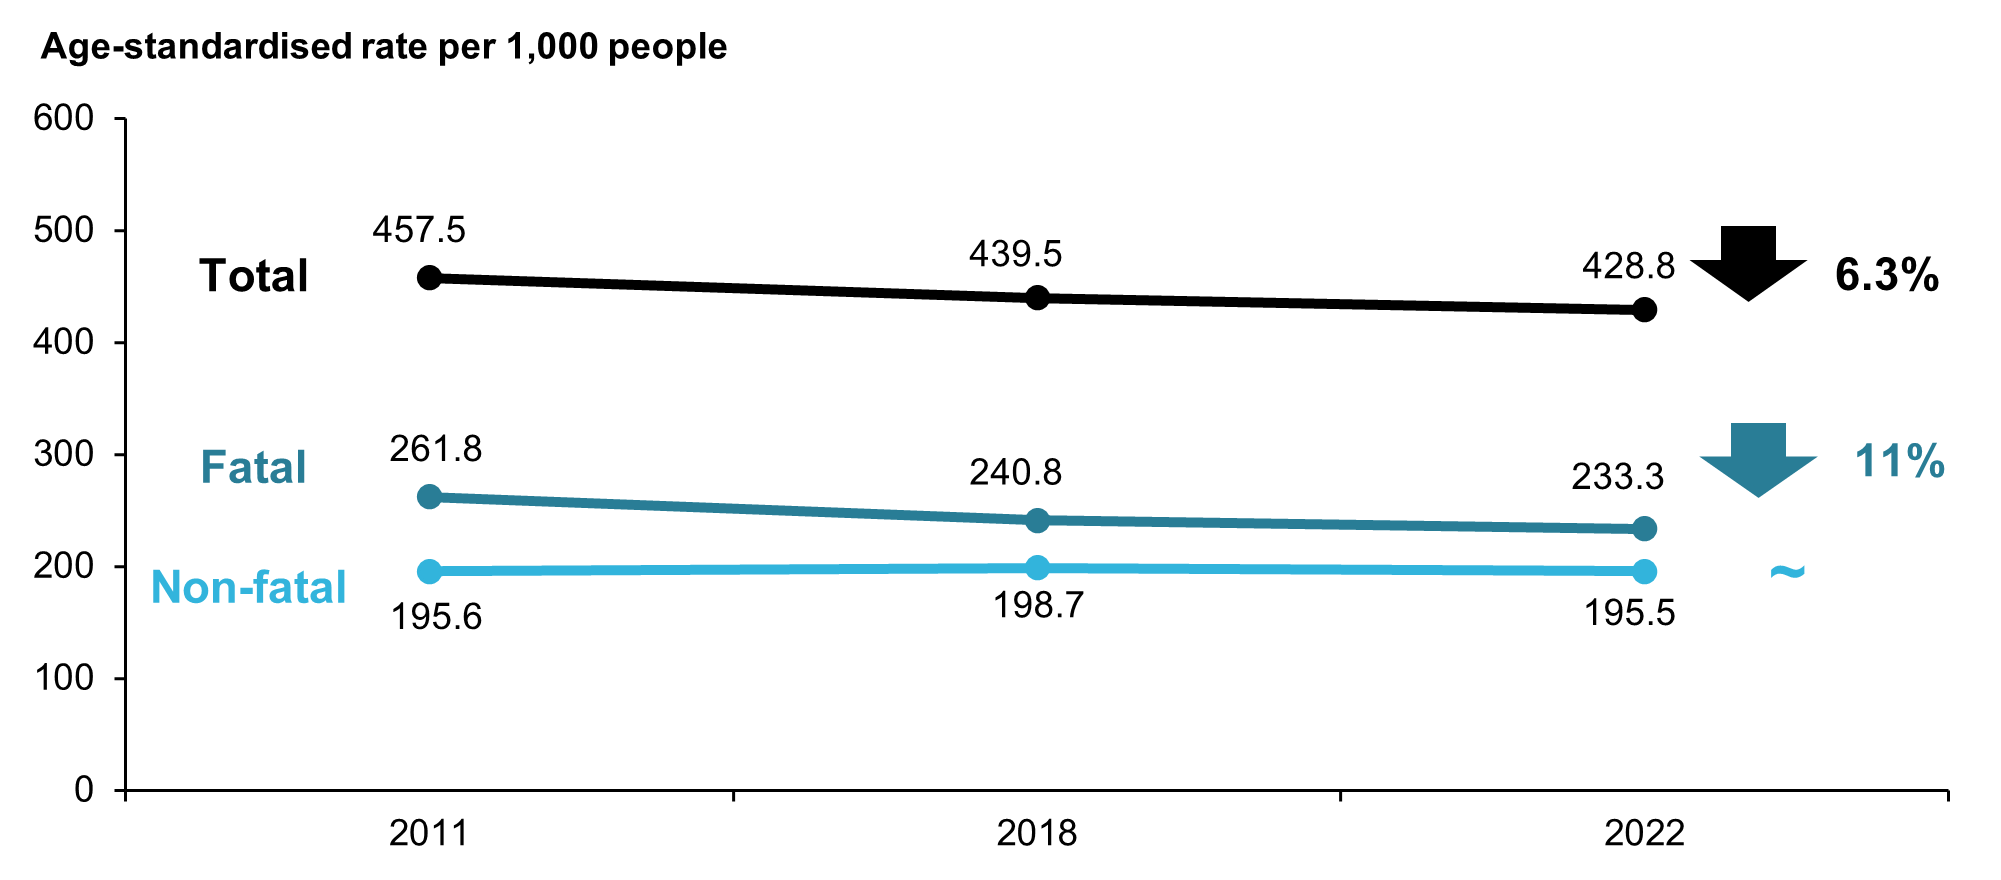
Note: Rates were age-standardised to the 2001 Australian Standard population.
Source: AIHW First Nations Burden of Disease Database
Gap in burden has narrowed over time
After adjusting for differences in population size and age structure, the absolute gap in burden (DALY rate difference) between First Nations people and non-Indigenous Australians decreased by 8.8% between 2011 and 2022, from 249 to 227 per 1,000 people. There was also a small drop in the relative gap, from a rate ratio of 2.2 in 2011 to 2.1 in 2022. This was largely driven by a narrowing of the gap for fatal burden, which decreased by 9.8% between 2011 and 2022. The gap in non-fatal burden also decreased during this period, by 7.4%. There was no change in the relative gap for fatal burden (a rate ratio of 2.4 in 2011 and 2022), while there was a slight drop for non-fatal burden (from a rate ratio of 2.0 in 2011 to 1.9 in 2022).
The decrease in the gap in non-fatal burden was driven by an increase in the rate of non-fatal burden among non-Indigenous Australians between 2011 and 2022 (7.3% increase, from 98 to 105 YLD per 1,000 people).
Figure 6: Change between 2011 and 2022 in the gap in age-standardised total (DALY), fatal (YLL), and non-fatal (YLD) burden rate (per 1,000 people) between First Nations people and non-Indigenous Australians
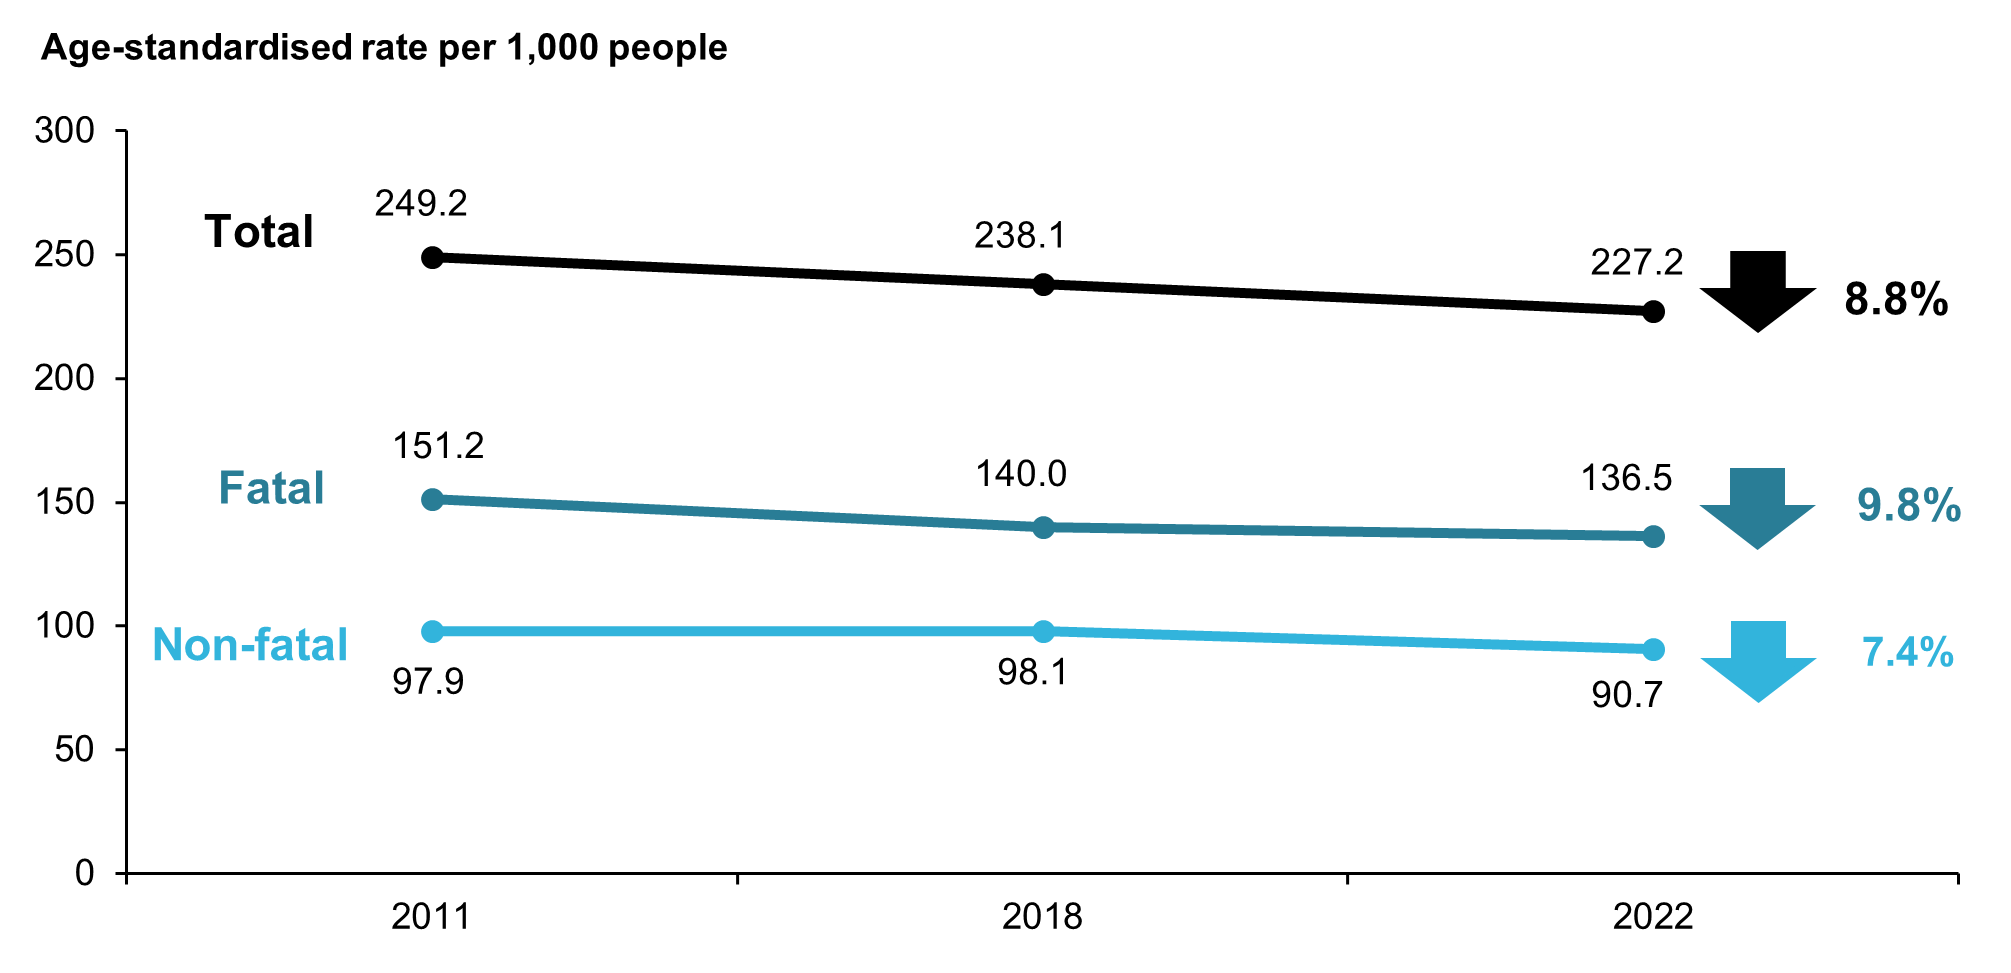
Note: Rates were age-standardised to the 2001 Australian Standard population.
Source: AIHW First Nations Burden of Disease Database
A large proportion of the burden occurs in mid-life
Disease burden is not evenly distributed over the different stages of life.
- Infants, children and young adults aged under 25 comprised around half (51%) of the First Nations population but accounted for just under a quarter (23%) of the total burden in 2022.
- Adults aged 25–64 comprised 43% of the First Nations population and more than half (58%) of the total burden.
- Adults aged 65 and over comprised 5.6% of the population but accounted for 19% of the total burden.