Changes in burden over time
Key messages
- There was a 6.3% decrease in the age-standardised rate of total burden between 2011 and 2022, from 457 to 429 DALY per 1,000 people.
- The decrease in total burden was driven by a reduction (of 11%) in the age-standardised rate of fatal burden between 2011 and 2022, from 262 to 233 YLL per 1,000 people.
- There was no substantial change in the age-standardised rate of non-fatal burden between 2011 and 2022.
- Between 2011 and 2022 there were notable decreases in the age-standardised total burden rate for cardiovascular diseases (decrease of 21 DALY per 1,000 people), endocrine disorders (decrease of 7.2 DALY per 1,000), and musculoskeletal conditions (decrease of 7.0 DALY per 1,000)
- Between 2011 and 2022 there were notable increases in the age-standardised total burden rate for infectious diseases (increase of 8.5 DALY per 1,000) and mental health conditions & substance use disorders (increase of 6.5 DALY per 1,000). Most of the increase in burden due to infectious diseases was due to the emergence of COVID-19.
- Although coronary heart disease (CHD) remained the leading cause of disease burden in 2022, the total burden age-standardised rate for CHD fell by 30% between 2011 and 2022, from 45 to 32 DALY per 1,000 people.
Overall, the health of First Nations people has improved over the period from 2011 to 2022.
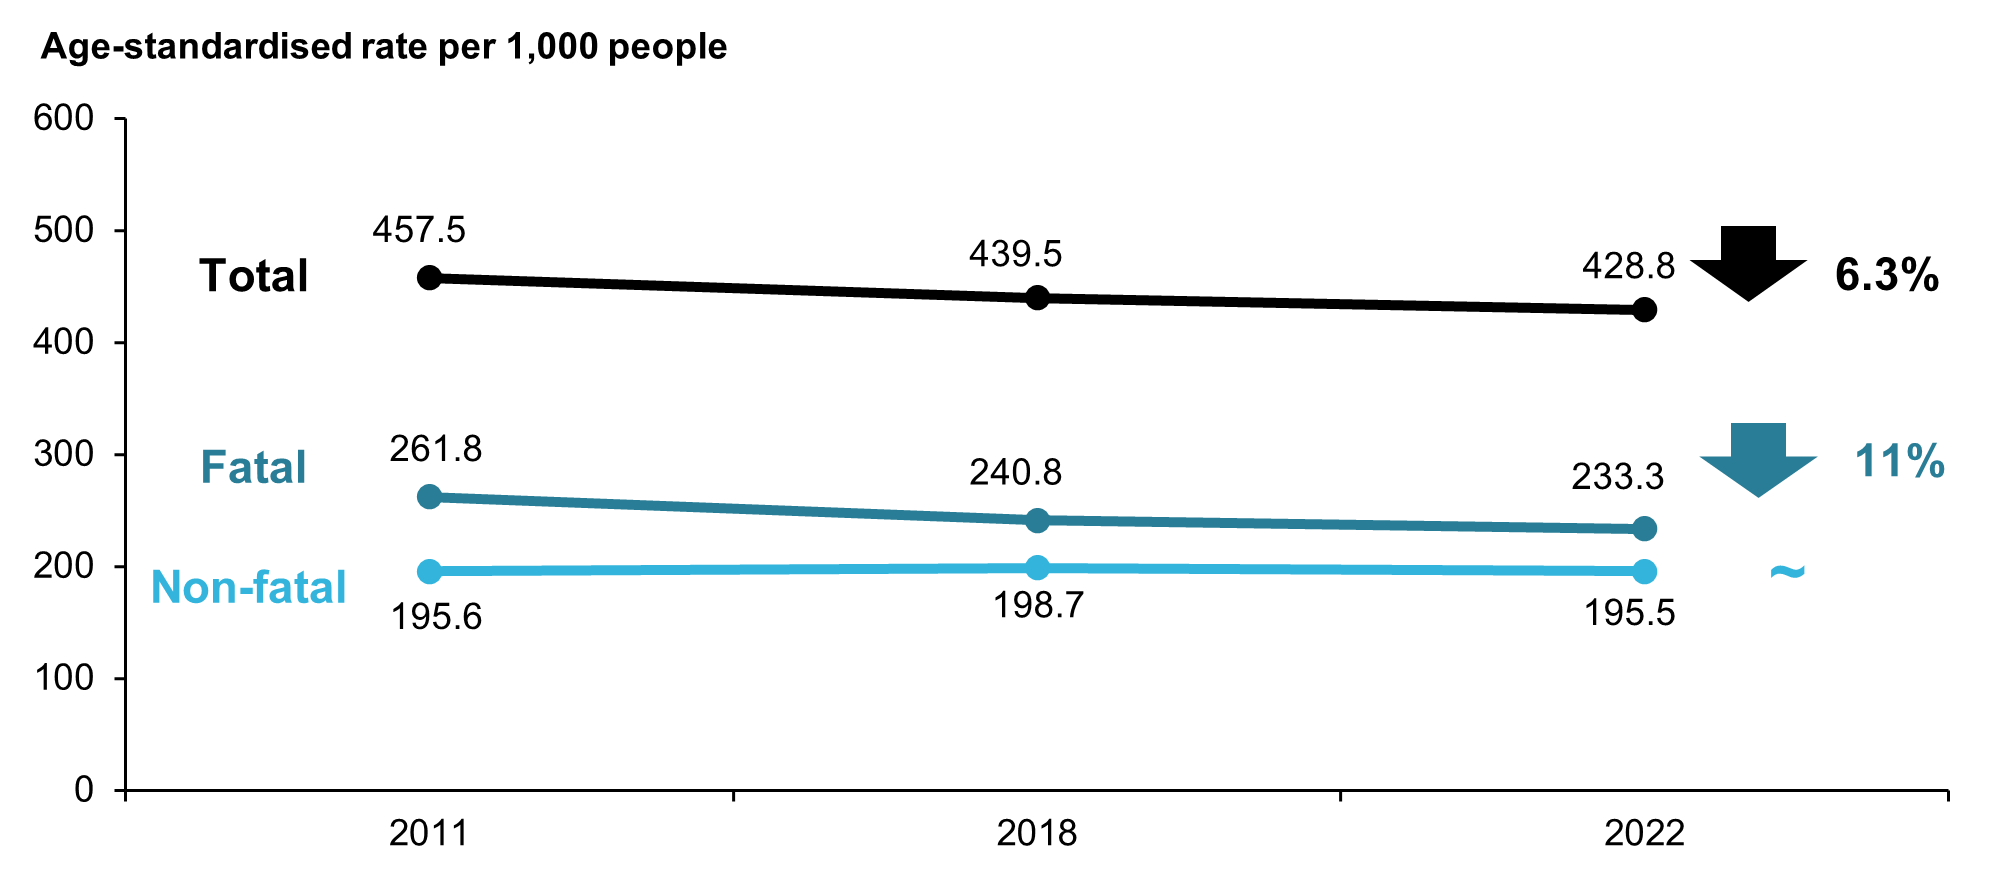
After accounting for the increase in size and ageing of the First Nations population (by using age-standardised rates), there was a 6.3% decrease in the rate of total burden between 2011 and 2022, from 457 to 429 DALY per 1,000 people. Most of this decline was observed between 2011 and 2018, while the DALY rate remained relatively stable between 2018 and 2022 (Figure 14).
The decrease in total burden was driven by a reduction (of 11%) in the age-standardised rate of fatal burden between 2011 and 2022, from 262 to 233 YLL per 1,000 people. There was no substantial change in the age-standardised rate of non-fatal burden between 2011 and 2022 (Figure 14).
Note that this stability from 2018 to 2022 may be attributed to the COVID-19 pandemic which had both direct health effects from the virus itself, and indirect health effects from COVID-19 acting as a risk factor for other diseases, and as a result of the public health measures and restrictions put in place (AIHW 2022). Due to the impact of these indirect health effects, simply subtracting the estimated disease burden due to COVID‑19 from the total burden does not necessarily reflect the disease burden that would have been experienced if the COVID-19 pandemic did not occur.
To explore changes in disease burden by disease group and leading causes see Dashboard 3: Comparisons over time. This visualisation presents comparisons of age-standardised and age-specific rates of total, fatal and non-fatal burden by year, sex and disease group.
Figure 14: Change between 2011 and 2022 in the age-standardised total burden (DALY), fatal burden (YLL), and non-fatal burden (YLD) rate (per 1,000 people), First Nations people
Note: Rates were age-standardised to the 2001 Australian Standard population.
Source: AIHW First Nations Burden of Disease Database
Changes by disease group
Between 2011 and 2022 there were decreases in the age-standardised total burden rate in around half of the 17 disease groups. The most notable decreases in DALY were for:
- cardiovascular diseases – a decrease of 21 DALY per 1,000 people, or 26%
- endocrine disorders – a decrease of 7.2 DALY per 1,000, 28%
- musculoskeletal conditions – a decrease of 7.0 DALY per 1,000, 18%
- cancer & other neoplasms – a decrease of 4.7 DALY per 1,000, 7.6%.
Increases were observed for infectious diseases (increase of 8.5 DALY per 1,000, or 74%) and mental health conditions & substance use disorders (increase of 6.5 DALY per 1,000, 11%). Most of the increase in burden due to infectious diseases was due to the emergence of COVID-19.
Non-fatal burden
Most disease groups showed little change in the age-standardised rate of non-fatal burden between 2011 and 2022. The largest increase in YLD was for:
- mental health conditions & substance use disorders – an increase of 7.9 YLD per 1,000 people, or 14%.
The largest decreases in the age-standardised rate of non-fatal burden were for:
- musculoskeletal conditions – a decrease of 6.9 YLD per 1,000, or 19%
- hearing & vision disorders – a decrease of 4.8 YLD per 1,000, 27%.
Fatal burden
Over the period 2011 to 2022, there were large reductions in the age-standardised rate of fatal burden from:
- cardiovascular diseases – a decrease of 19 YLL per 1,000 people, or 28%
- endocrine disorders – a decrease of 7.4 YLL per 1,000, 42%
- cancer & other neoplasms – a decrease of 5.1 YLL per 1,000, 8.6%.
There was an increase in the age-standardised rate of fatal burden due to infectious diseases of 7.0 YLL per 1,000, or 89%, primarily due to the emergence of COVID-19.
To explore the changes over time in the DALY, YLD, and YLL for each disease group, see Dashboard 3: Comparisons over time.
Changes in leading specific causes
The 15 leading causes of total burden, based on age-standardised DALY rate, among First Nations people remained largely the same between 2011 and 2022, except for the introduction of COVID-19 in 2022 (Figure 15).
Coronary heart disease was the leading cause of burden among First Nations people in both 2011 and 2022. Although coronary heart disease remained the leading cause of disease burden in 2022, the age-standardised total burden rate fell by 30% between 2011 and 2022 (from 45 to 32 DALY per 1,000 people).
Age-standardised total burden rates also decreased notably for:
- stroke (33% decrease)
- hearing loss (29% decrease)
- type 2 diabetes (28% decrease)
- alcohol use disorders (27% decrease).
To explore the changes in leading specific causes of total, non-fatal and fatal burden over time, see Dashboard 4: Leading causes of disease burden. This visualisation shows the top 20 contributors to total, fatal and non-fatal burden based on age-standardised rates in 2011, 2018 and 2022 for males, females and persons, and how this has changed over time.
Figure 15: Change in ranking and age-standardised DALY rate (DALY per 1,000 people), leading specific causes of burden, First Nations people, 2011 and 2022

ASR = Age-standardised rate
Notes:
- An increase in rank over time does not always mean the disease or injury has increased in the population, and vice versa. Therefore, changes in ranking of causes of deaths and disease burden over time should be interpreted with caution.
- Causes are presented in descending order, from highest ASR to lowest ASR, with arrows indicating either an increase (orange), decrease (blue) or no change (black) in the ASR over time.
- Causes ranked in the leading 15 causes in 2011, which are not among the leading 15 causes in 2022 will not have connecting lines and rankings.
- Cause rankings exclude ‘other‘ residual conditions from each disease group; for example, ‘other musculoskeletal conditions’.
- There were changes in practices of coding deaths due to dementia; therefore, caution is recommended when interpreting changes over time for dementia burden.
- For information on colours used for each specific cause, see disease group colours for FNBDS 2022 colour legend.
Source: AIHW First Nations Burden of Disease Database