Technical notes
Overarching methods
General methods for estimation of burden of disease can be found in Australian Burden of Disease Study: methods and supplementary material 2018 (AIHW 2021b).
Data sources
Mortality data to calculate ‘years of life lost’ (fatal burden, YLL) estimates were sourced from the AIHW’s National Mortality Database (NMD). Given the high quality of these data, no modelling had to be undertaken to adjust for coverage or completeness for national estimates. Some redistribution of the data based on cause of death was undertaken to fit the burden of disease cause categories. For First Nations YLL estimates, adjustments were made to account for under-identification of First Nations people in mortality records (for more information see Adjusting for Indigenous under-identification).
For ‘years lived with disability’ (non-fatal burden, YLD) estimates, as there is no single comprehensive and reliable source of data on the incidence, prevalence, severity and duration of all non-fatal health conditions, morbidity estimates were drawn from a wide variety of sources and generally based on the best single source. This included administrative data, national surveys, disease registers and epidemiological studies. Potential sources for disease-specific morbidity data were required to: have case definitions appropriate to the disease being analysed; be relevant to the First Nations population; and be timely, accurate, reliable and credible.
Why use estimates from the First Nations Burden of Disease Study (FNBDS) 2022 instead of Aboriginal and Torres Strait Islander component of ABDS 2018?
Estimates from the FNBDS 2022 supersede those produced for the Aboriginal and Torres Strait Islander component of ABDS 2018. This First Nations Burden of Disease Study 2022 provides burden of disease estimates best matched to the Australian public health context for the Aboriginal and Torres Strait Islander population for 2022. It also provides estimates for 2011 and 2018, revised using the same methods as for 2022, to enable direct comparisons. The latest year, 2022, reflects the data availability from key data sources (such as the National Aboriginal and Torres Strait Islander Health Survey, deaths data, hospital admissions data and various disease registers) at the time of analysis.
Improvements made in the First Nations Burden of Disease Study 2022 include:
- COVID-19 added to the list of diseases
- new data sources or evidence from latest epidemiological studies
- new or revised conceptual models to estimate YLD for some diseases in line with changes to the ABDS disease list or new evidence
- recalculation of estimates for 2011 and 2018, to enable comparison with 2022 estimates
- updated reference life table used in calculation of YLL estimates.
Therefore, published estimates from previous Australian studies are not directly comparable with those for the First Nations Burden of Disease Study 2022 due to methodology changes.
Earlier reference years
For YLL, estimates for earlier reference years (2011, 2018) have been revised to incorporate changes in mortality coding under the ABS revisions process. Once a year, the ABS revises mortality information for coroner-certified deaths to improve the accuracy of the coding of these deaths. These revisions do not increase the overall number of deaths in any year but may change the distribution of the causes of death. Further information on the ABS mortality revisions process is available on the ABS website.
For YLD, estimates for earlier reference years were largely revised due to changes in population data.
Updates to estimates for specific mental health conditions
National estimates for 2011 and 2018 were revised for conditions sourced from the National Survey of Mental Health and Wellbeing (NSMHW) (specifically depressive disorders, anxiety disorders, bipolar affective disorder and alcohol use disorder). This was to account for changes in prevalence between the 2007 and 2020–22 surveys at the national level.
For these conditions, the change in national estimates has led to a change in First Nations estimates for 2011 and 2018. Specifically, due to a lack of data on diagnosed prevalence of mental and substance use disorders in the Aboriginal and Torres Strait Islander population, indirect methods are employed to derive prevalence. For these conditions, rate ratios were calculated from linked Queensland Health Admitted Patient Data Collection (QHAPDC) and Consumer Integrated Mental Health Application (CIMHA) data. These rate ratios were then applied to nationally calculated rates to derive First Nations prevalence.
YLD estimates for autism spectrum disorders for 2018 were also updated following a revision to WA Intellectual Disability Exploring Answers (IDEA) data, which has been linked to the National Disability Insurance Scheme (NDIS), resulting in higher ascertainment of individuals with autism spectrum disorders. YLD estimates for 2018 were revised to allow comparisons with 2022 estimates, however, it should be noted that estimates for 2018 and 2022 are not strictly comparable to estimates for 2011 due to this addition of a new ascertainment source in the IDEA.
COVID-19
For the first time, COVID-19 has been included in the First Nations Burden of Disease Study as part of the infectious diseases group. The method used for the estimation of the burden of COVID-19 for First Nations people in 2022 is outlined below.
Estimation of COVID-19 for 2022 fatal burden (YLL)
Methods for calculating fatal burden (expressed as YLL) of COVID-19 used the number of deaths directly due to COVID-19, the ages at which these deaths occurred, and the Global Burden of Disease Study (GBD) standard reference life table.
Definition and coding of COVID-19 deaths
In the International Classification of Diseases 10th revision (ICD-10), COVID-19 deaths are coded in 2 ways:
- ICD-10 code U07.1 – ‘COVID-19 virus identified’ is used when COVID-19 is confirmed by laboratory testing.
- ICD-10 code U07.2 – ‘COVID-19 virus not identified’ is used for suspected or clinical diagnoses of COVID-19 where testing is not completed or inconclusive.
In FNBDS 2022, deaths coded to U07.1 and U07.2 as the underlying cause of death (death directly due to COVID-19) were used to estimate fatal burden. Mortality data were adjusted for First Nations under-identification.
Data sources
COVID-19 deaths for 2022 were sourced from the Nationally Mortality Database.
Non-fatal burden (YLD)
Conceptual model
The conceptual model for COVID-19 is shown in Figure 1, which was the consensus model being used by the European Burden of Disease Network (EBDN) and the Australian Burden of Disease Study (ABDS) to calculate non-fatal burden due to COVID-19 at the time of analysis.
Important components of the YLD model which acquire health loss (Figure 1) include:
- Mild/moderate cases: correspond to those not requiring hospitalisation to treat their disease. It is noted that some cases in Australia were hospitalised to maintain strict isolation rather than because of the severity of their disease (particularly at the start of the pandemic).
- Severe cases: correspond to those hospitalised to treat their disease, but not requiring admission to intensive care units (ICU).
- Critical cases: correspond to people who were treated in ICU.
- Post-acute consequences: correspond to cases with post COVID-19 condition (also known as ‘long COVID’).
Permanent functional impairment from COVID-19 was not included in this study due to a lack of evidence. More elapsed time is needed to understand these potential consequences.
Figure 1: Conceptual model for COVID-19 burden of disease analysis
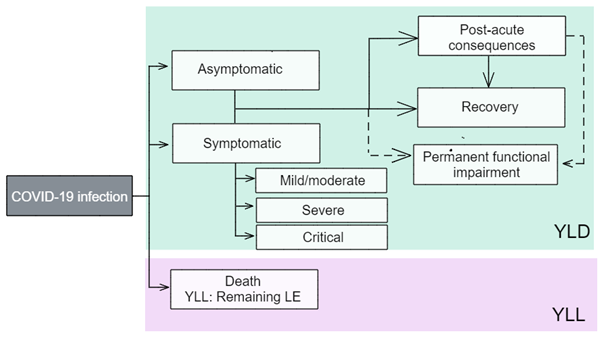
LE = life expectancy; YLD= years lived with disability; YLL= years of life lost.
Source: ABDS2022
Model parameters: disability weights and disease durations
The ‘disability weights’ reflect the severity of the disease and correspond to a ‘health state’ which describes the average experience for people at that severity level. Table 1 outlines the disability weights for each health state. The disability weights were drawn from ABDS 2022.
Health state type | Severity level | Health state | Disability weight |
|---|---|---|---|
Acute infectious disease | Asymptomatic | Has infection but experiences no symptoms | Nil |
Acute infectious disease | Mild/moderate | Has a fever and aches, and feels weak, which causes some difficulty with daily activities | 0.051 |
Acute infectious disease | Severe | Has a high fever and pain, and feels very weak, which causes great difficulty with daily activities | 0.133 |
Acute infectious disease | Critical | Intensive care unit admission | 0.655 |
Chronic infectious disease | Post-acute consequences | Is always tired and easily upset, the person feels pain all over the body and is depressed. | 0.219 |
The duration used for mild/moderate cases was 7 days due to the shorter duration of Omicron infection, which was the dominant variant in Australia in 2022 (Menni et al. 2022). The duration parameters for severe and critical cases were calculated using empirical data on length of stay from the National Hospital Morbidity Database (NHMD). Hospitalisations without an ICU admission were used for severe cases, and those with ICU admission for critical cases. Length of stay for critical cases only included time spent in ICU - their time spent outside of the ICU was counted under the length of stay for severe cases.
The average duration parameter used for post-acute consequences was 5 months (Tindle 2024). This is a broad assumption as data on the full trajectory for people with long COVID are still emerging.
Data sources
Broadly, the numbers of people in each severity category were required. The input data needed to reflect the full coverage of cases, with any under-ascertainment adjusted for with appropriate data, if available. Under-ascertainment for COVID-19 is becoming a bigger issue as time goes on due to the move from close contact tracing and strict requirements for PCR-based testing, to rapid antigen testing and reliance on self-reporting. Under-ascertainment is discussed further in each severity category.
Asymptomatic cases
An AIHW COVID-19 report (AIHW 2021c) used figures from a meta-analysis (Byambasuren et al. 2020) to estimate the proportion of asymptomatic COVID-19 cases. This showed that 17% of cases were truly asymptomatic (for example, excludes pre-symptomatic cases). However, this review was conducted in 2020 and due to the emergence of newer variants and sub-variants, higher vaccination rates and changes in requirements for COVID-19 testing in 2022, it is likely this proportion is no longer suitable.
As no data on asymptomatic cases were available, it was assumed that the NNDSS only includes symptomatic cases, and the inclusion of asymptomatic cases is minimal in estimates of mild/moderate cases.
Mild/moderate cases
This was calculated as the total number of confirmed cases recorded in the NNDSS. A disability weight of 0.051 was applied to all confirmed cases. Hospitalised cases, including those admitted to ICU, were not excluded from the mild/moderate case count. This is based on the assumption that individuals with severe or critical illness also experience a period of moderate acute infection prior to and after hospitalisation for COVID-19.
Under-ascertainment would be highest in the mild/moderate category. Given the lower severity (and hence lower contribution per case to the disease burden) in this category and challenges with adjusting for under-ascertainment with currently available data, there was not enough information to inform adjustments for under-ascertainment in this study. There are serosurvey studies that measure the prevalence of antibodies to SARS-CoV-2 in the blood donor population (for example, the National Centre for Immunisation Research and Surveillance, the Kirby Institute’s Australian COVID-19 Serosurveillance Network serosurveys). However, the blood donor population may not be representative of the general Australian population.
Severe and critical cases
The number of severe cases is the number of First Nations cases admitted to hospital minus those admitted to ICU during 2022, adjusted for First Nations under-identification in hospitalisation data.
Critical cases are the number of First Nations cases admitted to ICU, adjusted for First Nations under-identification in hospitalisation data.
It is assumed that there would be virtually no under-ascertainment among the severe and critical categories as it is unlikely that people who require hospital care would not receive that care in Australia. People admitted would almost certainly have been tested for SARS-CoV-2 if there was any chance they had contracted it.
As there may be people who contracted COVID-19 in hospital (but did not suffer from severe or critical disease), identification of these cases in the data would be useful for burden estimation when more detailed hospitals data become available. However, it is acknowledged that because these cases cannot be identified, it may result in an overestimate of the burden due to severe COVID-19 (though an underestimate of mild/moderate cases). To reduce the extent of over-estimation of severe cases, COVID-19 hospitalisations were identified as those with a principal diagnosis indicating COVID-19, or an additional diagnosis of COVID-19 with a principal diagnosis in the ICD-10-AM chapters ‘Certain infectious and parasitic diseases’, ‘Diseases of the respiratory system’, or ‘Symptoms, signs and abnormal clinical and laboratory findings, not elsewhere classified’.
Post-acute consequences
For the FNBDS 2022, a proportion of 4.5% (for those aged 25 years and older) and a proportion of 1.44% (for those aged under 25 years) were used to estimate the number of cases who developed post-acute consequences from their COVID-19 infection. The proportion for those aged 25 years and over was sourced from the study by Antonelli et al. (2022) and was the proportion of Omicron cases who experienced long COVID. This proportion was not used for those aged under 25 years as there is evidence showing the likelihood of getting long COVID in younger age groups is lower (GBD Long COVID Collaborators 2022). The proportion for those aged under 25 years was based on the estimated percentage of people under 25 years living in private households with self-reported long COVID of any duration in the UK. This proportion was based on the UK Coronavirus (COVID-19 Infection Survey) data for the 4-week period ending 3 September 2022 (ONS 2022).
Population data
Changes to the Aboriginal and Torres Strait Islander population
On 24 July 2024, the ABS released Estimates and projections, Aboriginal and Torres Strait Islander Australians, 2011 to 2031 based on the 2021 Census. The release included detailed backcast population estimates from 2011 to 2020 and projections to 2031.
Between 2016 and 2021, the Census-based Aboriginal and Torres Strait Islander population estimates increased by 25.2%, with less than half (43.5%) of this increase being due to demographic factors (births, deaths and migration). The rest of the increase was due to other (non-demographic) factors (56.5%), including changes in the propensity of people to identify as Indigenous.
The substantial amount of non-demographic change between the 2016 and 2021 Censuses – more than double that seen previously – suggests that identification has changed quite significantly in the past few years. It seems unlikely that such a substantial change would be limited to the Census and not show up in other administrative data sources.
Which population data was used in FNBDS 2022?
As a result of the changes in the Aboriginal and Torres Strait Islander population, all First Nations population-based rates in the FNBDS 2022 were calculated using an interpolated population series. The interpolated population series uses the 2011, 2016 and 2021 Census points as anchors and assumes a consistent growth from one Census point to another. Identification change is inherent as part of the Census points. The AIHW projected the interpolated series forward one year to maintain demographic consistency between the interpolated population for historical years (2011, 2018) and the 2022 reference year.
Non-Indigenous population estimates were calculated by subtracting the interpolated Aboriginal and Torres Strait Islander population estimates from the total Australian population estimates for the same years.
The Australian 2001 standard population (published 20 June 2013) was used for all age-standardisation, as per AIHW and ABS standards.
Adjusting for Indigenous under-identification
The National Hospital Morbidity Database (NHMD) and the AIHW’s National Mortality Database (NMD) are key data sources used for estimating the burden of disease in the FNBDS 2022. However, hospitalisations and deaths of First Nations people are under-identified to varying degrees across state/territory and remoteness areas as well as over time. The incompleteness of First Nations identification means that hospital separations and deaths recorded as Indigenous are an underestimate of the actual number of hospitalisations and deaths of First Nations people.
The National Health Data Hub (NHDH), formerly the National Integrated Health Services Information (NIHSI) analytical asset, is a major national health data linkage system that brings together hospitalisation data from 1 July 2010 to 30 June 2022, and National Death Index (NDI) records from 1 July 2010 to 31 December 2022, with other data sets including the Medicare Benefits Schedule (MBS), Pharmaceutical Benefits Scheme (PBS), Aged care services data, and the Australian Immunisation Register (AIR) data.
The NHDH hospitalisation data included Admitted patient care data and Emergency Department Care data in public and private hospitals for all states and territories with the exception of Western Australia and the Northern Territory. Note that Non-Admitted Patient episode-level data were not available for FNBDS 2022.
The NHDH was used to derive under-identification adjustment factors for hospitalisation and mortality data for the 2022 reference year in the FNBDS 2022. Adjustment factors for Western Australia derived from the Western Australian Data Linkage System were provided by WA Health, as hospital data for WA are not included in the NHDH.
Hospitalisation adjustment factors by state/territory and remoteness area were calculated by dividing the number of First Nations hospitalisations in the Admitted Patient Data based on the NHDH-enhanced First Nations identification, by the observed number of First Nations hospitalisations originally recorded in the Admitted Patient Data.
Similarly, 2022 mortality adjustment factors by state/territory and remoteness area were calculated by dividing the number of First Nations deaths in the Mortality Data based on the NHDH-enhanced First Nations identification, by the observed number of First Nations deaths recorded in the National Death Index (NDI). The year 2021 was selected to determine mortality adjustment prior to the introduction of dual-source identification for NSW deaths in 2022. It is assumed that the level of under-identification of First Nations people in mortality data otherwise remained consistent between 2021 and 2022.
Under-identification adjustment factors for 2011 and 2018 were obtained from previous AIHW analyses (AIHW 2013 and 2023).
Note that this method assumes that data for people who are identified as First Nations people in these two data sources are representative of First Nations people who are not identified as such. While this is not necessarily the case, it is the best information available at present.
Hospital presentation ratios
The National Hospital Morbidity Database (NHMD) was a key data source for estimating non-fatal burden for some diseases in FNBDS 2022. However, the NHMD provides counts of the number of hospital separations rather than the number of individual patients and to estimate point prevalence, the FNBDS needed data relating to people rather than clinical events.
AIHW analyses of linked hospitalisations and deaths data from the NHDH was used to calculate people–to–hospitalisations ratios for New South Wales, Queensland, Victoria, South Australia, Tasmania and the Australian Capital Territory for selected sequelae. These ratios were then applied to corresponding hospitalisation counts by sex and age from the NHMD to derive a count of people.
Linked hospitals and deaths data from Western Australia were also used by WA Health to calculate people–to–hospitalisations ratios for selected sequelae.
A combination of data from the NHDH and Western Australia was used as the hospital presentation ratios across all states and territories.
Reference life table
The reference life table used in burden of disease methodology to measure years of life lost due to early death is an aspirational goal designed to represent the gold standard of life expectancy (see Data for reference life table). The reference life table is different to the actual life tables for the First Nations and the non-Indigenous populations, with the aspirational life expectancies at all ages being greater than those currently experienced in Australia.
All previous iterations of the ABDS (ABDS 2011 onwards) have used the Global Burden of Disease (GBD) 2010 Standard Reference Life Table (SRLT) (Murray et al. 2012). A more recent GBD life table, the GBD 2021 Theoretical Minimum Risk Reference Life Table (TMRLT), has been used in the FNBDS 2022. The GBD 2021 TMRLT is an internationally recognised and accepted reference table for burden of disease analysis representing the most recent expression of aspirational life expectancies based on lowest worldwide mortality rates.
Compared with the GBD 2010 life table, the GBD 2021 life table increases life expectancy at birth and up to around age 90 by approximately 4 years, and by around 5 years thereafter. Therefore, using the GBD 2021 life table results in an increase in YLL, and a higher proportion of total burden contributed by YLL, compared to previous ABDS results.
To ensure comparability between population groups and over time, the same reference life table was used for First Nations and non-Indigenous fatal burden estimates, all analyses by sex, all subnational analyses, and for all reference years (2011, 2018 and 2022) in the FNBDS 2022.
Indigenous status in New South Wales deaths data
In New South Wales, the method for identifying Indigenous status in deaths data changed in 2022. Prior to 2022, the Indigenous status of deaths registered in NSW was derived from the Death Registration Statement (DRS) only but from 2022 onward, information from the Medical Certificate of Cause of Death (MCCD) was used as a secondary source to help determine the Indigenous status of the deceased. As a result of improved identification of First Nations people, the number of reported First Nations deaths in NSW rose sharply in 2022. To maintain comparability with data from earlier years used in FNBDS, a deaths file where the secondary source method had not been applied was provided by the NSW Register of Births, Deaths and Marriages for use in FNBDS analyses. Under-identification adjustment based on 2021 data was applied as described above.
YLL and YLD data quality
The quality of input estimates in the FNBDS 2022 for earlier reference years (2011 and 2018) are the same as the quality presented in the ABDS 2018. Therefore, refer to Appendix B in the Australian Burden of Disease Study: impact and causes of illness and death in Australia 2018 report (AIHW 2021a) and the Australian Burden of Disease Study: methods and supplementary material 2018 report (AIHW 2021b) for more detail on the quality of the YLD estimates and the data and methods used for the earlier reference years.
COVID-19 was added to the FNBDS 2022 as a new disease. To help users understand the potential sources of uncertainty associated with the estimates, the 2-dimensional index developed for the burden estimates was used for this disease. This index was derived based on:
- the relevance of the underlying epidemiological data
- the methods used to transform that data into a form required by this analysis.
The quality of COVID-19 estimates is discussed below.
COVID-19
Estimates for acute consequences of COVID-19 are of good quality. Data sources for acute consequences were considered relevant as they were directly observed from the NNDSS and the NHMD, adjusted for First Nations under-identification. However, the estimates for post-acute consequences of COVID-19, which is the biggest contributor to non-fatal burden, were calculated using 2 proportions (one proportion for those aged under 25 years and another for those aged 25 years and over) so substantial modelling was done to estimate burden by sex and 5-year age groups. Therefore, estimates for post-acute consequences of COVID-19 should be interpreted with caution.
Data score = D
Method score = D
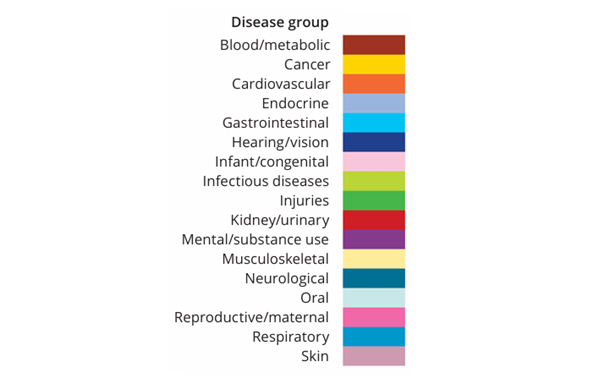
Disease group colours
For ease of recognition in FNBDS 2022 published results, each of the 17 disease groups has been allocated a distinct colour. Within figures presented in this report, specific causes also use the same distinct colour as their disease group. These colours are: