Indicator 3.8 Diabetes hospitalisations by type of diabetes
On this page
Consideration
Symptoms of type 1 and type 2 diabetes are similar, particularly in young adults, and the diagnosed diabetes type, and subsequently coded diabetes type are not always correct (Stone et al. 2010).
3.8.1 Type 1 diabetes
Overview
In 2017–18, there were around 61,900 hospitalisations with a principal and/or additional diagnosis of type 1 diabetes —250 per 100,000 population.
Trends
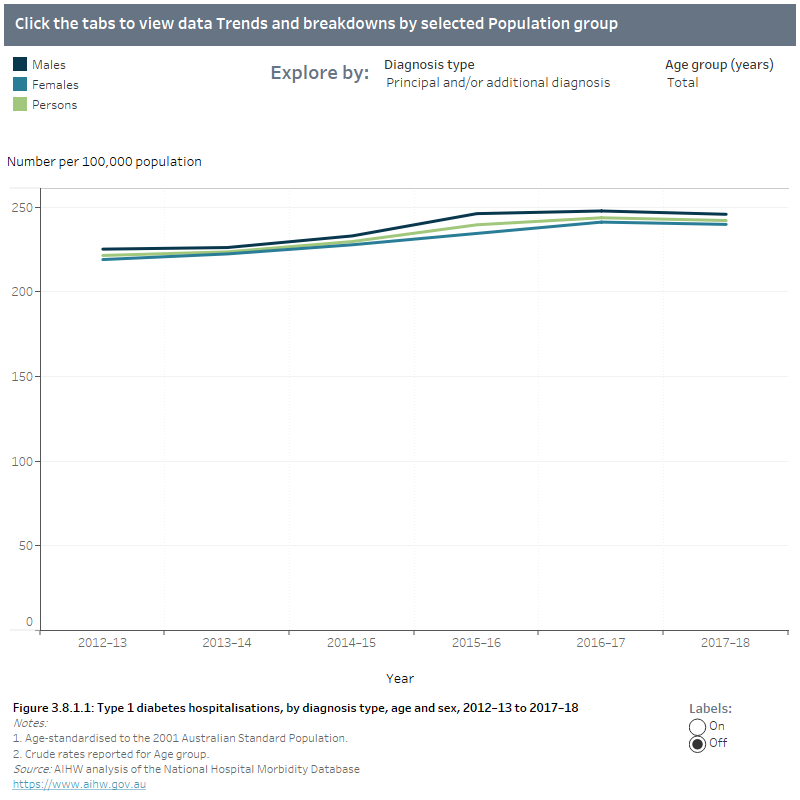
After adjusting for age, type 1 diabetes hospitalisation rates remained relatively similar between 2012–13 and 2017–18 (222 and 242 per 100,000 population, respectively) (Figure 3.8.1.1).
Age and sex
The age-standardised hospitalisation rates for type 1 diabetes were slightly higher in males than females (246 and 240 hospitalisations per 100,000 population, respectively) in 2017–18. Age-specific rates peaked in those aged 65–74 (407 hospitalisations per 100,000 population) (Figure 3.8.1.1).
Population groups
Age-standardised hospitalisation rates for type 1 diabetes varied across the remoteness areas, with the highest rate in Inner regional (317 per 100,000 population) and the lowest hospitalisation rate in Remote and very remote areas (192 per 100,000 population). Rates were 1.6 times as high among those living in the lowest socioeconomic areas compared to those living in the highest socioeconomic areas (305 and 188 per 100,000, respectively) (Figure 3.8.1.2).
State and territory
There was some variation between states and territories with the highest hospitalisation rate with a principal and/or additional diagnosis of type 1 diabetes in Tasmania (335 per 100,000 population) and lowest hospitalisation rate in the Northern Territory (149 per 100,000 population) (Figure 3.8.1.2).
Aboriginal and Torres Strait Islander people
In 2017–18, there were around 3,000 hospitalisations with a principal and/or additional diagnosis of type 1 diabetes among Aboriginal and Torres Strait Islander people, equating to 361 per 100,000 population. After adjusting for age, the hospitalisation rate was almost twice as high among Indigenous people compared with non-Indigenous people (446 and 233 per 100,000, respectively) (Figure 3.8.1.2).
Explore the data
3.8.1 Type 1 diabetes hospitalisations, by diagnosis type, age and sex, 2012–13 to 2017–18 and by selected population group, 2017–18
Trends figure 3.8.1.1 shows diabetes hospitalisations remained stable across all diagnosis types from 2012-13 to 2017-18. Hospitalisations with a principal and/or additional diagnosis of Type 1 diabetes increased from 222 to 242 per 100,000 from 2012-13 to 2017-18.
Population group figure 3.8.1.2 shows in 2017-18 hospitalisations with a principal and/or additional diagnosis of Type 1 diabetes were similar among males and females (246 and 240 per 100,000 population, respectively). Rates peaked among those aged 65-74 with 407 hospitalisation per 100,000 population. Hospitalisations were nearly twice as high among Indigenous Australians as non-Indigenous Australians (446 and 233 per 100,000 population, respectively) and were highest among Indigenous males at 525 per 100,000 population. Rates of hospitalisation increased with socioeconomic disadvantage and were 1.7 times as high among persons living in Inner regional areas as persons living in Remote and very remote areas (317 and 192 per 100,000 population, respectively). Among the states and territories, hospitalisations were highest in Tasmania (335 per 100,000 population) and lowest in the Northern Territory (149 per 100,000 population).
|
|
Definition |
Data source |
|---|---|---|
|
Numerator |
Number of hospital separations (principal; additional; principal and/or additional diagnosis) for type 1 diabetes (ICD-10-AM: E10). |
AIHW National Hospital Morbidity Database (NHMD) |
|
Denominator |
Estimated Australian resident population |
AIHW Population Database (sourced from ABS Australian Demographic Statistics and Estimates and Projections, Aboriginal and Torres Strait Islander Australians) |
3.8.2 Type 2 diabetes
Overview
In 2017–18, there were around 1.1 million hospitalisations with a principal and/or additional diagnosis of type 2 diabetes – 5,500 per 100,000 population.
Trends
After adjusting for age, the hospitalisation rates for type 2 diabetes increased from 3,800 per 100,000 in 2012–13 to 4,900 per 100,000 population in 2017–18 (Figure 3.8.2.1).
Age and sex
The age-standardised hospitalisation rate was 1.4 times as high among men as women (5,700 and 4,100 hospitalisations per 100,000 population, respectively). Age-specific hospitalisation rates increased with age, reaching a peak in those aged 75–84 (24,400 per 100,000 population) (Figure 3.8.2.1).
Population groups
Hospitalisation rates for type 2 diabetes increased with remoteness and socioeconomic disadvantage. Rates were 2.5 times as high among those living in Remote and very remote areas as Major cities (11,500 and 4,600 per 100,000 population, respectively). Rates were 2.0 times as high among those living in the lowest socioeconomic areas compared to those living in the highest socioeconomic areas (6,700 and 3,300 per 100,000, respectively) (Figure 3.8.2.2).
State and territory
Hospitalisation rates for type 2 diabetes varied by state and territory in 2017–18, from 3,300 per 100,000 population in the Australian Capital Territory to 11,100 per 100,000 population in the Northern Territory (Figure 3.8.2.2).
Aboriginal and Torres Strait Islander people
In 2017–18, there were around 69,000 hospitalisations with a principal and/or additional diagnosis of type 2 diabetes among Indigenous adults, a rate of 14,000 per 100,000 population. The age-standardised hospitalisation rate was almost 5 times as high among Indigenous adults as non-Indigenous adults (19,000 and 4,500 per 100,000, respectively) (Figure 3.8.2.2).
Explore the data
3.8.2 Type 2 diabetes hospitalisations, by diagnosis type, age and sex, 2012–13 to 2017–18 and by selected population group, 2017–18
Trends figure 3.8.2.1 shows hospitalisations with Type 2 diabetes as a principal and/or additional diagnosis have steadily increased for all age groups from 2012-13 to 2017-18. Between 2012-13 and 2017-18, hospitalisations with Type 2 diabetes as an additional diagnosis increased from 3,700 to 4,700 per 100,000 population. Hospitalisations with type 2 diabetes as a principal diagnosis remained stable, increasing slightly from 136 to 158 per 100,000 population.
Population group figure 3.8.2.2 shows in 2017-18 hospitalisations with Type 2 diabetes as an additional and/or principal diagnosis were 1.4 times as high among males as females (5,700 and 4,100 hospitalisations per 100,000 population, respectively). Hospitalisation rates increased with age, peaking among those aged 75-84 at 24,400 per 100,000 population. Hospitalisation rates for Type 2 diabetes were over 3 times as high among Indigenous males as non-Indigenous males (17,400 and 5,400 per 100,000 population, respectively) and nearly 6 times as high among Indigenous females and non-Indigenous females (20,600 and 3,700 per 100,000 population respectively). Hospitalisations increased with socioeconomic disadvantage and were 2.5 times as high in Remote and very remote areas as Major cities (11,500 and 4,600 per 100,000 population, respectively). The rate of hospitalisations differed among states and territories, with rates being lowest in the Australian Capital Territory and highest in the Northern Territory (3,300 and 11,100 hospitalisations per 100,000 population).
|
|
Definition | Data source |
|---|---|---|
|
Numerator |
Number of hospital separations (principal; additional; principal and/or additional diagnosis) for type 2 diabetes (ICD-10-AM: E11). |
AIHW NHMD |
|
Denominator |
Estimated Australian resident population (18+ years). |
AIHW Population Database (sourced from ABS Australian Demographic Statistics and Estimates and Projections, Aboriginal and Torres Strait Islander Australians) |
3.8.3 Diabetes during pregnancy
Overview
In 2017–18, around 62,800 women were admitted to hospital with a principal and/or additional diagnosis of diabetes during pregnancy, a rate of 18,000 per 100,000 females aged 10–54 years with a pregnancy outcome.
Trends
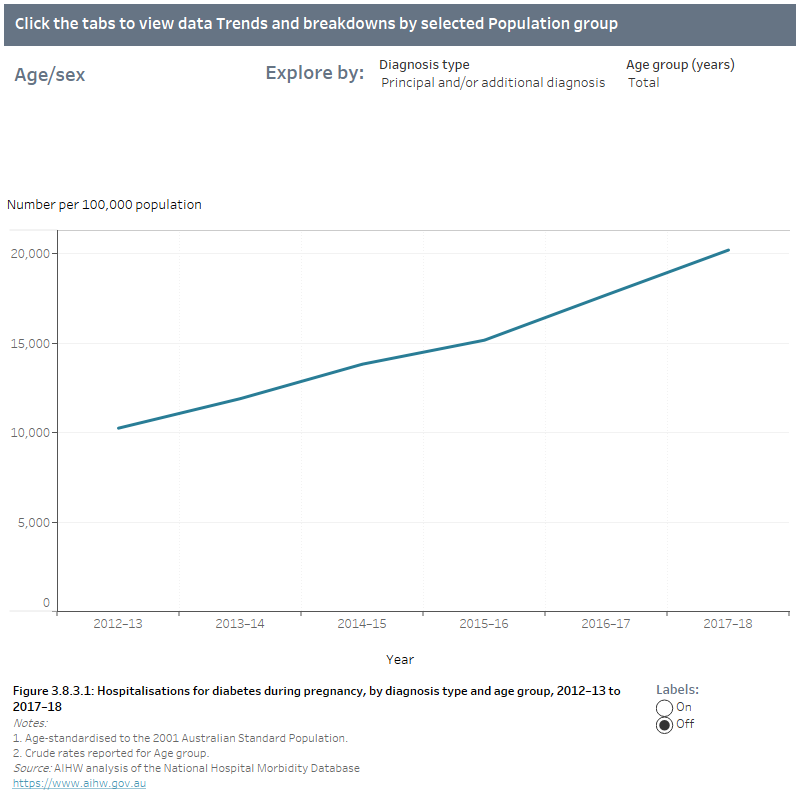
Age-standardised hospitalisation rates increased from 10,300 per 100,000 females aged 10–54 years with a pregnancy outcome in 2012–13 to 20,200 per 100,000 females in 2017–18 (Figure 3.8.3.1).
Age
The hospitalisation rate increased with age, reaching a peak in those aged 45–54 (34,200 per 100,000 females) (Figure 3.8.3.1).
Population groups
Hospitalisation rates for diabetes during pregnancy rose with increasing socioeconomic disadvantage. Rates were almost twice as high among those living in the lowest socioeconomic areas as those living in the highest socioeconomic areas (26,100 and 14,100 per 100,000 females aged 10–54 years with a pregnancy outcome, respectively). Compared with females living in Major cities, those living in Remote and very remote areas were 2.5 times as likely to be hospitalised with diabetes during pregnancy (19,400 and 48,500 per 100,000 females aged 10–54 years with a pregnancy outcome, respectively) (Figure 3.8.3.2).
State and territory
Rates varied by state and territory with the Australian Capital Territory having the highest rate (29,400 per 100,000 females aged 10–54 years with a pregnancy outcome) and Western Australia having the lowest rate (14,200 per 100,000 females) (Figure 3.8.3.2).
Aboriginal and Torres Strait Islander people
Around 3,800 Aboriginal and Torres Strait Islander females were admitted to hospital with a principal and/or additional diagnosis of diabetes during pregnancy, a rate of 24,700 per 100,000 females aged 10–54 years with a pregnancy outcome. Age-standardised rates were 1.8 times as high among Indigenous females in this cohort as non-Indigenous females (36,300 and 19,800 per 100,000 females, respectively) (Figure 3.8.3.2).
About the data
Rates for this indicator have been calculated based on the number of hospitalisations of females with a pregnancy outcome.
Diabetes in pregnancy data includes hospitalisations with principal and/or additional diagnosis of gestational diabetes. Caution should be taken when comparing rates over time, due to a number of factors affecting the diagnosis of gestational diabetes in Australia in recent years. These include the introduction of new diagnostic guidelines and increasing risk factors in the population (see trends discussion in Incidence of gestational diabetes in Australia for more information).
Explore the data
3.8.3 Hospitalisations for diabetes during pregnancy, by diagnosis type and age group, 2012–13 to 2017–18 and by selected population group, 2017–18
Trends figure 3.8.3.1 shows hospitalisations for diabetes as a principal and/or additional diagnosis during pregnancy steadily increased from 10,300 to 20,200 per 100,000 population between 2012-13 and 2017-18.
Population group figure 3.8.3.2 shows in 2017-18 the rate of hospitalisations for diabetes during pregnancy (principal and/or additional diagnosis) increased with age. Rates were highest among females aged 45-54 at 34,200 per 100,000 population. Hospitalisations for diabetes during pregnancy were almost twice as high among Indigenous females as non-Indigenous females (36,300 and 19,800 per 100,000 population). Rates increased with remoteness and socioeconomic disadvantage, with hospitalisations 2.5 times as high in Remote and very remote areas as Major cities (48,500 and 19,400 per 100,000 population, respectively). Among the states and territories, hospitalisations for diabetes during pregnancy ranged from 14,200 per 100,000 population in Western Australia to 29,400 per 100,000 population in the Australian Capital Territory.
|
|
Definition |
Data source |
|---|---|---|
|
Numerator |
Number of hospital separations (principal; additional; principal and/or additional diagnosis) for diabetes in pregnancy (ICD-10-AM: O24). |
AIHW NHMD |
|
Denominator |
Number of hospitalisations for pregnancy outcomes (ICD-10-AM: Z37, O03 O04, O05, O06, O80, O81, O82, O83, O84, P95 and P964). |
AIHW NHMD |
3.8.4 Diabetes - other and unspecified
Overview
In 2017–18, there were around 14,100 hospitalisations with a principal and/or additional diagnosis of other and unspecified diabetes – 57 per 100,000 population.
Trends
After adjusting for age, hospitalisation rates remained relatively stable between 2012–13 and 2017–18 (between 47 and 54 per 100,000 population) (Figure 3.8.4.1).
Age and sex
The age-standardised hospitalisation rates were slightly higher in males than females (57 and 48 hospitalisations per 100,000 population, respectively) in 2017–18. Age-specific rates peaked in those aged 75–84 (170 hospitalisations per 100,000 population) (Figure 3.8.4.1).
Population groups
Age-standardised hospitalisation rates were slightly higher among those living in the lowest socioeconomic areas compared to those living in the highest socioeconomic areas (56 and 49 hospitalisations per 100,000 population, respectively), and higher among those living in Remote and very remote areas compared to those living in Major cities (63 and 53 hospitalisations per 100,000 population, respectively) (Figure 3.8.4.2).
State and territory
Rates varied by state and territory with South Australia having the highest rate (75 hospitalisations per 100,000 population) and the Australian Capital Territory having the lowest (25 hospitalisations per 100,000 population) (Figure 3.8.4.2).
Aboriginal and Torres Strait Islander people
In 2017–18, there were around 885 hospitalisations with a principal and/or additional diagnosis of other and unspecified diabetes among Aboriginal and Torres Strait Islander people, equating to 156 per 100,000 population. After adjusting for age, the hospitalisation rate was more than 3 times as high among Indigenous people as non-Indigenous people (156 and 48 per 100,000, respectively).
Explore the data
3.8.4 Hospitalisations by diabetes type: ‘Other & unspecified’, by diagnosis type, age and sex, 2012–13 to 2017–18 and by selected population group, 2017–18
Trends figure 3.8.4.1 shows hospitalisations for the diabetes type ‘Other & unspecified’ slightly increased from 2012–13 to 2017–18. Diabetes hospitalisations with a principal and/or additional diagnosis of ‘Other & unspecified’ increased from 47 per 100,000 population in 2012-13 to 52 per 100,000 population in 2017-18. During this period, hospitalisations were highest among those aged 75-84, with rates slightly decreasing from 175 per 100,000 population in 2012-13 to 170 per 100,000 population in 2017-18.
Population group figure 3.8.4.2 shows hospitalisations for the diabetes type ‘Other & unspecified by diagnosis type and population groups in 2017-8. Diabetes hospitalisations with a principal and/or additional diagnosis of ‘Other & unspecified’ peaked among males aged 75-84 (221 per 100,000 population) and females aged 65-74 (140 per 100,000 population). Hospitalisations were 2.6 times as high among Indigenous males as non-Indigenous males (140 and 53 per 100,000 population) and nearly 4 times as high among Indigenous females as non-Indigenous females (174 and 44 per 100,000 population, respectively). Hospitalisations were slightly higher among those living in the lowest socioeconomic areas compared to the highest socioeconomic area (56 and 49 hospitalisations per 100,000 population, respectively). Rates of hospitalisation were highest among males living in Major cities (59 per 100,000 population) and females living in Remote and very remote areas (70 per 100,000 population). Among the states and territories, hospitalisations for the diabetes type ‘Other & unspecified’ were lowest in the Australian Capital Territory and highest in South Australia (25 and 75 per 100,000 population, respectively).
|
|
Definition |
Data source |
|---|---|---|
|
Numerator |
Number of hospital separations (principal; additional; principal and/or additional diagnosis) for other and unspecified diabetes (ICD-10-AM: E13 and E14). |
AIHW NHMD |
|
Denominator |
Estimated Australian resident population. |
AIHW Population Database (sourced from ABS Australian Demographic Statistics and Estimates and Projections, Aboriginal and Torres Strait Islander Australians) |
References
Stone MA, Camosso‐Stefinovic J, Wilkinson J, Lusignan SD, Hattersley AT & Khunti K 2010. Incorrect and incomplete coding and classification of diabetes: a systematic review. Diabetic Medicine 27:491–7.