Indigenous clients
Aboriginal and Torres Strait Islander people are more likely than non-Indigenous Australians to experience insecure housing, live in overcrowded dwellings and experience homelessness, including intergenerational homelessness. They continue to be over-represented in both the national homeless population and as users of specialist homelessness services (see Clients, services and outcomes and [1]). Indigenous Australians are a national priority homelessness cohort in the National Housing and Homelessness Agreement [2], which came into effect 1 July 2018.
Aboriginal and Torres Strait Islander people make up 3.2% of the Australian population [3], yet they made up 25% of the clients (an estimated 65,200 clients) assisted by specialist homelessness services in 2017–18. It is important to note that Indigenous status was not reported for 10% of specialist homelessness services (SHS) clients in 2017–18 (similar to 2016–17; 9%).
Key findings in 2017–18
- Indigenous SHS client numbers increased by 1% since 2016–17 to around 65,200 in 2017–18, growing at a similar rate to the general SHS population (2% increase).
- There were more returning Indigenous clients (62%) (that is, those who had received assistance at some time in the previous 5 years) than new Indigenous clients (38%) in 2017–18.
- The length of support for Indigenous clients continues to increase, with the median number of days up from 46 in 2016–17 to 48 days in 2017–18, and is longer than that for non-Indigenous clients (44 days in 2017–18).
- The proportion of Indigenous clients receiving accommodation services decreased to 41% in 2017–18, down from 42% in 2016–17; and the median length of accommodation remained the same (20 nights) but remains significantly shorter than non-Indigenous clients (41 nights).
- Around 3,200 more Indigenous clients ended support in public or community housing and 1,100 fewer Indigenous clients were in short-term or emergency accommodation following assistance from SHS agencies in 2017–18.
Profile of Indigenous clients in 2017–18
Of the 65,200 Indigenous clients who received services in 2017–18:
- Around 1 in 5 (22% or 14,500) were children aged under 10, compared with 15% (or around 28,200) of non-Indigenous clients.
- Just over half (53% or 34,600 clients) were aged under 25, compared with 40% of non-Indigenous clients (or 78,300 clients).
- Of all Indigenous clients, there were twice as many females aged over 18 (42% or over 27,600 clients) than males aged over 18 (21% or 13,600 clients). By comparison, of all non-Indigenous clients, 46% were females aged over 18 and 28% were male.
- There were more returning Indigenous clients (62% or 40,500 clients) than new Indigenous clients (38% or 24,700 clients). That is, more Indigenous clients had received assistance at some point in the previous 5 years than new Indigenous clients seeking assistance from a SHS in 2017–18.
- Looking at the main reason for seeking assistance, 1 in 4 (25%) sought assistance from a SHS agency because of domestic and family violence and a further 21% because of a housing crisis. Non-Indigenous clients also reported these two main reasons most commonly, with a higher proportion reporting domestic and family violence (28%) and a similar proportion reporting housing crisis (22%).
- Over 1 in 3 (35%) were living as single parents with a child or children when they approached an agency for support, similar to non-Indigenous clients (34%).
Vulnerabilities
Indigenous clients may be facing any number of challenges when they present to a SHS agency for assistance, specifically domestic and family violence, mental health issues and problematic drug and/or alcohol use. Over half (56%) of Indigenous clients reported 1 or more of these vulnerabilities (Table INDIGENOUS.1), less than non-Indigenous clients (63%).
Almost 2 in 5 Indigenous clients (37% of Indigenous clients aged 10 and over or 18,600 clients) reported domestic and family violence. Almost 4,400 clients (9%) reported experiencing both domestic and family violence and mental health issues, while almost 2,300 clients (4%) reported experiencing mental health issues and drug/alcohol problems. Just over 2,300 Indigenous clients (5%) reported all three vulnerabilities (domestic and family violence, mental health issues and problematic drug and/or alcohol use)—similar rates to non-Indigenous clients (3%).
|
Domestic and family violence |
Mental health issue |
Problematic drug and/or alcohol use |
Clients |
Per cent |
|---|---|---|---|---|
|
Yes |
Yes |
Yes |
2,300 |
4.6 |
|
Yes |
Yes |
No |
4,400 |
8.6 |
|
Yes |
No |
Yes |
1,300 |
2.6 |
|
No |
Yes |
Yes |
2,200 |
4.4 |
|
Yes |
No |
No |
10,600 |
20.9 |
|
No |
Yes |
No |
5,800 |
11.4 |
|
No |
No |
Yes |
1,800 |
3.6 |
|
No |
No |
No |
22,200 |
43.8 |
|
|
|
|
50,700 |
100 |
Notes
- Client vulnerability groups are mutually exclusive.
- Clients are aged 10 and over.
- Totals may not sum due to rounding.
Source: Specialist Homelessness Services Collection 2017–18.
Indigenous clients: 2015–16 to 2017–18
Over 213,300 Indigenous clients have been supported by homelessness agencies since the Specialist Homelessness Services Collection (SHSC) began in 2011–12. The number of Indigenous clients has been steadily increasing over this time. The key trends identified over the past 3 years have been:
- The rate of service use by Indigenous clients has increased from 787 clients per 10,000 Indigenous people in 2015–16 to 803 in 2017–18 (Table INDIGENOUS.2).
- The gap between the rate of Indigenous and non-Indigenous SHS clients continues to widen. In 2017–18 Indigenous people were 9.4 times as likely to use specialist homelessness services as non-Indigenous people, up from 9.1 times in 2015–16.
- After taking into account differences in population size, in 2017–18 Indigenous clients accessed services at the highest rate in Inner/outer regional areas, consistent with 2016–17 but differing from previous years where the highest rate was in Major cities.
- The rate of service use among Indigenous clients living in Remote/very remote areas has decreased over time; from 732 Indigenous clients per 10,000 population in 2015–16 to 712 in 2017–18. The rate of use for non-Indigenous clients in the same areas has also decreased, from 41 clients per 10,000 in 2016–17 to 38 in 2017–18.
- The length of support for Indigenous clients continues to increase, with the median number of days up from 46 in 2016–17 to 48 days in 2017–18, and is longer than that for non-Indigenous clients (44 days in 2017–18).
|
|
2015–16 Indigenous |
2015–16 Non-Indigenous |
2016–17 Indigenous |
2016–17 |
2017–18 Indigenous |
2017–18 |
|---|---|---|---|---|---|---|
|
Number of clients |
61,700 |
190,488 |
64,644 |
196,689 |
65,184 |
194,072 |
|
Proportion of all clients where Indigenous status reported |
24 |
76 |
25 |
75 |
25 |
75 |
|
Rate (per 10,000 population) |
787.0 |
86.5 |
813.9 |
88.4 |
802.7 |
85.7 |
|
Rate ratio |
9.1 |
|
9.2 |
|
9.4 |
|
|
Rate difference |
700.5 |
|
725.6 |
|
717.0 |
|
|
Remoteness rate (per 10,000 population) |
||||||
|
Major cities |
823.9 |
80.6 |
832.4 |
80.7 |
814.7 |
78.1 |
|
Inner/outer regional |
789.2 |
110.5 |
852.3 |
115.3 |
845.3 |
115.3 |
|
Remote/very remote |
732.4 |
36.4 |
720.9 |
40.7 |
711.9 |
38.2 |
|
Rate ratio |
||||||
|
Major cities |
10.2 |
|
10.3 |
|
10.4 |
|
|
Inner/outer regional |
7.1 |
|
7.4 |
|
7.3 |
|
|
Remote/very remote |
20.1 |
|
17.7 |
|
18.7 |
|
|
Housing situation at the beginning of first support period (proportion (per cent) of all clients) |
||||||
|
Homeless |
46 |
43 |
47 |
43 |
47 |
43 |
|
At risk of homelessness |
54 |
57 |
53 |
57 |
53 |
57 |
|
Length of support (median number of days) |
44 |
37 |
46 |
39 |
48 |
44 |
|
Average number of support periods per client |
1.7 |
1.7 |
1.7 |
1.7 |
1.8 |
1.8 |
|
Proportion receiving accommodation |
44 |
30 |
42 |
29 |
41 |
28 |
|
Median number of nights accommodated |
19 |
42 |
20 |
41 |
20 |
41 |
|
Proportion of a client group with a case management plan |
70 |
61 |
71 |
61 |
73 |
63 |
|
Achievement of all case management goals (per cent) |
21 |
23 |
20 |
22 |
23 |
22 |
Notes
- Rates were directly age-standardised as detailed in the Technical information section. Minor adjustments in rates may occur between publications reflecting revision of the estimated resident population by the Australian Bureau of Statistics.
- Rate ratio is the Indigenous rate divided by the non-Indigenous rate and is used to compare the 2 service use rates. Rate difference is the Indigenous rate minus the non-Indigenous rate. They are both measures of gaps, one is relative and one is absolute’.
- The denominator for the proportion achieving all case management goals is the number of client groups with a case management plan. Denominator values for proportions are provided in the relevant National supplementary table.
- Data for 2015–16 to 2016–17 have been adjusted for non-response. Due to improvements in the rates of agency participation and SLK validity, 2017–18 data are not weighted. The removal of weighting does not constitute a break in time series and weighted data from 2015–16 to 2016–17 are comparable with unweighted data for 2017–18. For further information, please refer to the Technical notes.
Source: Specialist Homelessness Services Collection 2015–16 to 2017–18.
Housing situation
At the beginning of support, the majority of Indigenous clients were housed but at risk of homelessness (53%) when first reporting to a SHS agency for assistance, the remainder (47%) were homeless (Table INDIGENOUS.2).
Services needed and provided
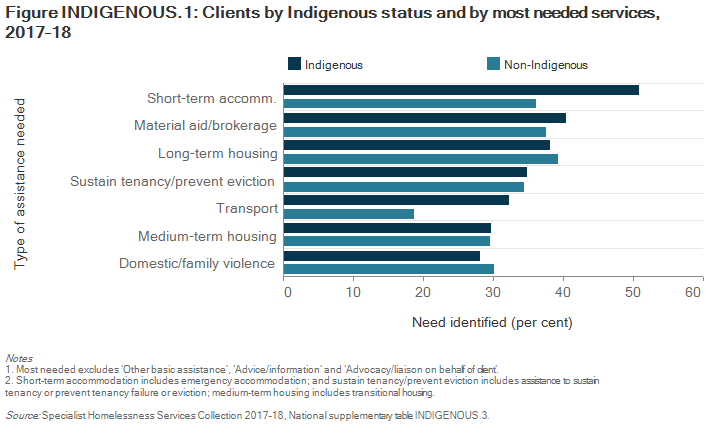
The need for accommodation assistance was broadly similar between Indigenous and non-Indigenous clients, with the exception of short-term or emergency accommodation (Figure INDIGENOUS.1). Half of Indigenous clients (51% or 33,200) needed short-term or emergency accommodation, compared with 36% (or 70,100) of non-Indigenous clients. Two-thirds of those Indigenous clients with the need for short-term or emergency accommodation received this support (67%); a higher proportion than non-Indigenous clients (56%).
Advice/information (80%), advocacy/liaison (58%) and material aid/brokerage (40%) were some of the most sought after general services for Indigenous clients. The majority of clients with these needs were provided with these services (99%, 97% and 88% respectively). Assistance for domestic and family violence was another frequently requested service (28%), with 90% of clients with this need having such assistance provided.
For some general services, needs were higher for Indigenous clients when compared with non-Indigenous clients, including meals (29% compared with 14%), laundry/shower facilities (25% compared with 11%) and transport (32% compared with 19%).
Housing outcomes
The outcomes presented in this section examine the changes in clients’ housing situations from the start to end of support. Only clients who ceased receiving support by the end of the financial year are included in this section—meaning their support periods had closed and they did not have ongoing support at the end of the 2017–18 reporting period. However, it is important to note that a proportion of these clients may seek assistance from SHS agencies again in the future.
For Indigenous clients (Supplementary table INDIGENOUS.4):
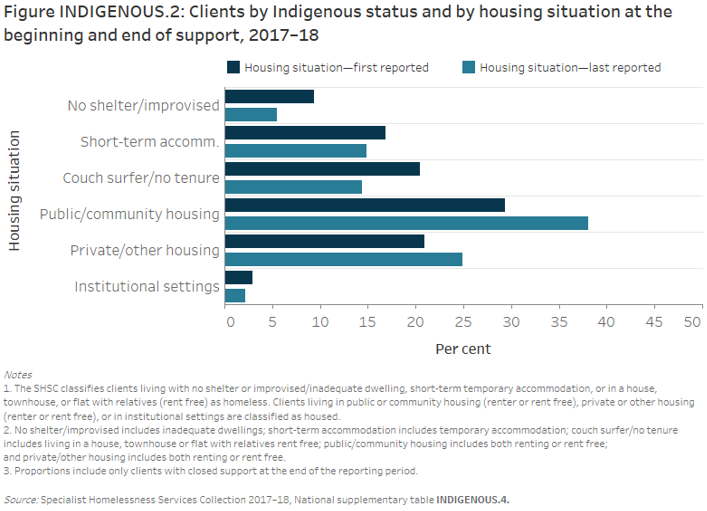
- 2 in 3 (65% or 27,700) Indigenous clients were housed at the end of support. This represents an increase of 4,200 clients in housing following SHS support (or up from 53% at the beginning of support).
- The most common housing outcome following support was public or community housing (38% or 16,200 clients) followed by private rental (25% or 10,600) (Figure INDIGENOUS.2). In contrast, for non-Indigenous clients, the most common housing outcomes at the end of support were private rental (50%) followed by public or community housing (16%).
- Most of the Indigenous clients who ended support homeless were in short-term or emergency accommodation (15% or 6,300 clients) and couch surfing (14% or 6,100 clients) with 6% rough sleeping (or 2,300 clients).
Of those clients who were housed but at risk of homelessness at the beginning of support (that is, living in either public or community housing (renter or rent-free), private or other housing (renter or rent-free), or in institutional settings):
- 9 in 10 (89% or 19,500 clients) were assisted to maintain their tenancy following SHS support. This is a similar proportion to non-Indigenous clients (90% or 61,200 clients).
- Around 9 in 10 of those living in public or community housing (86% or 10,600 clients) were assisted to maintain their tenancy, and a further 5% (600 clients) were assisted into private or other housing. By comparison, 84% of non-Indigenous clients (or 9,500 clients) living in public or community housing were assisted to maintain their tenancy, and a further 9% (or 1,000 clients) were assisted into private or other housing.
- Almost 3 in 4 (74% or 6,400 clients) of those living in private or other housing were assisted to maintain their tenancy, and a further 12% (or 1,000 clients) were assisted into public or community housing. By comparison, 85% (or 44,700 clients) of non-Indigenous clients living in private or other housing were assisted to maintain their tenancy, and a further 5% (or 2,800 clients) were assisted into public or community housing.
Of those clients who were homeless (that is, living either with no shelter or improvised/inadequate dwelling, short-term temporary accommodation, or in a house, townhouse, or flat with relatives (rent-free)) when they began SHS support (Table INDIGENOUS.3):
- The majority of Indigenous clients who presented as homeless, remained homeless (62%) at the end of support.
- Around 4 in 10 (38% or 7,200 clients) were assisted into housing (compared with 39% or 18,800 non-Indigenous clients).
- Almost half of Indigenous and non-Indigenous clients in short-term or emergency accommodation were assisted into housing (45% or 3,000 Indigenous clients compared with 45% or 8,100 non-Indigenous clients).
|
Situation at beginning of support |
Indigenous homeless |
Non-Indigenous homeless |
Indigenous housed |
Non-Indigenous housed |
|---|---|---|---|---|
|
Homeless |
61.7 |
60.5 |
38.3 |
39.5 |
|
At risk of homelessness |
11.4 |
9.6 |
88.6 |
90.4 |
Notes
- The SHSC classifies clients living with no shelter or improvised/inadequate dwelling, short-term temporary accommodation, or in a house, townhouse, or flat with relatives (rent-free) as homeless. Clients living in public or community housing (renter or rent-free), private or other housing (renter or rent-free), or in institutional settings are classified as housed.
- Proportions include only clients with closed support at the end of the reporting period. Per cent calculations are based on total clients, excluding ‘Not stated/other’.
Source: Specialist Homelessness Services Collection 2017–18, National supplementary table INDIGENOUS.4 .
References
- Australian Bureau of Statistics (ABS), 2012. Census of population and housing: estimating homelessness, 2011. ABS cat. no. 2049.0. Canberra: ABS.
- Council on Federal Financial Relations 2018. National Housing and Homelessness Agreement.
- ABS 2018. Australian demographic statistics, Mar 2018. ABS cat. no. 3101.0. Canberra: ABS.