Clients with disability
The 2015 ABS Survey of Disability, Ageing and Carers (SDAC) estimates that almost 1 in 5 Australians (18.3% of the total population) have a disability. This estimate includes all those with any disability, ranging from mild to severe disabilities [1]. The measure of disability in the Specialist Homelessness Services Collection (SHSC) identifies those who always or sometimes need help or supervision with one or more core activities (self-care, mobility and communication) due to a long-term health condition or disability.
In 2017–18, 23,400 specialist homelessness services (SHS) clients reported one or more limitations with a core activity (self-care, mobility, and/or communication). Of these, 7,900 clients (or 3% of all SHS clients) reported that they always or sometimes needed assistance. It is this subgroup of people living with disability, those with severe or profound core activity limitation, who are described in this section. In this report, ‘severe or profound core activity limitation’ is sometimes abbreviated to ‘severe or profound disability’.
The analysis of the availability and appropriateness of homelessness services for this group of clients contributes to information about people with disability across a range of government services.
Key findings in 2017–18
- 7,900 clients assisted by homelessness agencies reported a severe or profound core activity limitation.
- A similar number of females (4,000 or 51%) reported severe or profound disability as males (3,900 or 49%).
- Most clients with a severe or profound disability were housed but at risk of homelessness when they sought assistance (54%).
- The age group with the highest proportion of adult clients with a severe or profound disability was 45–54. This age group had a higher proportion of female clients (54% compared with 46% male), in line with the general SHS population of the same age group (60% female and 40% male).
- Housing outcomes improved following support, with fewer clients homeless (30% down from 44% at the start of support).
- Most clients with severe or profound disability ended support housed (70% or almost 3,400); many in private or other housing (1,800 or 37%), up from 56% at the beginning of support. Public and community housing saw the greatest increase in client numbers from 17% at the start of support up to 27%.
- Clients with severe or profound disability received an average of 2.5 support periods; this is higher than the general SHS population (1.7).
- Over half of this client group (63%) had received homelessness services at some time in the previous 5 years.
The reporting of disability in the SHSC
The SHSC disability questions are asked of all clients and are based on core activity limitations and whether the client has any need for assistance with these activities. It is important to note that data for clients with disability who require assistance may not be comparable across age groups due to differences in the interpretation of the SHSC disability questions. This issue mainly relates to young children, and therefore any comparisons between age groups should be made with caution.
Further details about measuring disability in the SHSC and the definition of a client with severe or profound core activity limitation are provided in Technical information.
Profile of clients with severe or profound disability in 2017–18
In 2017–18, 23,400 SHS clients had a core activity limitation. Of these, 7,900 clients (or 3% of all SHS clients) answered that they ‘always/sometimes need help and/or supervision’ with self-care, mobility or communication (Supplementary table DIS.1). Of these clients with a severe or profound disability:
- There were equal proportions male (49% or 3,900 clients) and female (51% or 4,000 clients).
- The proportion of those aged 55 or over was double that of the general SHS population (16% compared with 8%).
- Over 1 in 5 were Indigenous (22%), similar to all SHS clients (23%).
- 2 in 3 (68%) accessed services in Major cities and 20% in Inner regional areas, similar to the general SHS population (62% and 23% respectively).
- Over 1 in 3 (37%) were living alone when they approached homelessness services for assistance, higher than the general SHS population (30%).
In 2017–18, clients with profound or severe disability:
- received a median of 76 days of support, almost double the general SHS population (median 39 days) (Table DIS.2 and Table CLIENT.1). This may reflect these clients have more complex needs upon presentation
- were more likely to receive accommodation (38%) than the general SHS population (29%), and for those who did, the length of supported accommodation was much longer (median 58 nights compared with 32 nights for the general SHS population)
- had an average of 2.5 support periods per client. This was higher than the general SHS population (1.7 support periods per client)
- were more likely to be returning clients. Nationally, 63% of these clients had received SHS assistance at some time in the previous 5 years.
Vulnerabilities
Living with disability may not be the only challenge faced by this group of clients. Almost 3 in 4 (74% or nearly 4,500) clients with severe or profound disability aged 10 and over also reported experiencing additional vulnerabilities including mental health issues, problematic drug and/or alcohol use or domestic and family violence (compared with 62% of the total SHS population). Of those clients with severe or profound disability who did present with additional vulnerabilities (Table DIS.1):
- 1 in 3 (31%) reported experiencing a mental health issue. A further 15% experienced both a mental health issue and domestic and family violence.
- A further 7% of clients experienced all three vulnerabilities.
Table DIS.1: Clients with severe or profound core activity limitations by selected vulnerability characteristics, 2017–18
|
Domestic and family violence |
Mental health issue |
Problematic drug and/or alcohol use |
Clients |
Per cent |
|---|---|---|---|---|
|
Yes |
No |
No |
500 |
8.4 |
|
No |
Yes |
No |
1,900 |
30.9 |
|
No |
No |
Yes |
150 |
2.6 |
|
Yes |
Yes |
No |
870 |
14.5 |
|
No |
Yes |
Yes |
620 |
10.4 |
|
Yes |
No |
Yes |
40 |
0.7 |
|
Yes |
Yes |
Yes |
400 |
6.7 |
|
No |
No |
No |
1,550 |
25.9 |
|
|
|
|
4,500 |
100 |
Notes
- Client vulnerability groups are mutually exclusive.
- Clients are aged 10 and over.
- Totals may not sum due to rounding.
Source: Specialist Homelessness Services Collection 2017–18.
Clients with severe or profound disability: 2013–14 to 2017–18
It is important to note that changes over time should be made with caution due to changes in the interpretation of the disability questions (see Technical notes for more information).
Key trends identified over the previous 5 years of collection include:
- Despite an increase in the number of clients with a severe or profound disability across the 4 years to 2016–17, the number declined by 28% to 7,900 in 2017–18 (Table DIS.2).
- The median number of nights of accommodation increased from 50 nights in 2016–17 to 58 nights in 2017–18.
- Fewer people with severe or profound disability received accommodation; in 2017–18, 38% received accommodation, down from 42% five years earlier.
Table DIS.2: Clients with severe or profound core activity limitation: at a glance—2013–14 to 2017–18
|
2013–14 |
2014–15 |
2015–16 |
2016–17 |
2017–18 |
|
|---|---|---|---|---|---|
|
Number of clients |
6,979 |
8,789 |
9,812 |
10,988 |
7,902 |
|
Proportion of all clients |
3 |
3 |
4 |
4 |
3 |
|
Rate (per 10,000 population) |
3.0 |
3.7 |
4.1 |
4.5 |
3.2 |
|
Housing situation at the beginning of the first support period (proportion (per cent) of all clients) |
|
||||
|
Homeless |
43 |
43 |
44 |
44 |
46 |
|
At risk of homelessness |
57 |
57 |
56 |
56 |
54 |
|
Length of support (median number of days) |
68 |
59 |
64 |
65 |
76 |
|
Average number of support periods per client |
2.3 |
2.2 |
2.3 |
2.3 |
2.5 |
|
Proportion receiving accommodation |
42 |
40 |
39 |
39 |
38 |
|
Median number of nights accommodated |
58 |
55 |
55 |
50 |
58 |
|
Proportion of a client group with a case management plan |
73 |
68 |
70 |
70 |
74 |
|
Achievement of all case management goals (per cent) |
18 |
19 |
18 |
18 |
22 |
Notes
- Rates are crude rates based on the Australian estimated resident population (ERP) at 30 June of the reference year. Minor adjustments in rates may occur between publications reflecting revision of the estimated resident population by the Australian Bureau of Statistics.
- The denominator for the proportion achieving all case management goals is the number of client groups with a case management plan. Denominator values for proportions are provided in the relevant national supplementary table.
- Data for 2013–14 to 2016–17 have been adjusted for non-response. Due to improvements in the rates of agency participation and SLK validity, 2017–18 data are not weighted. The removal of weighting does not constitute a break in time series and weighted data from 2013–14 to 2016–17 are comparable with unweighted data for 2017–18.
Source: Specialist Homelessness Services Collection 2013–14 to 2017–18.
States and territories
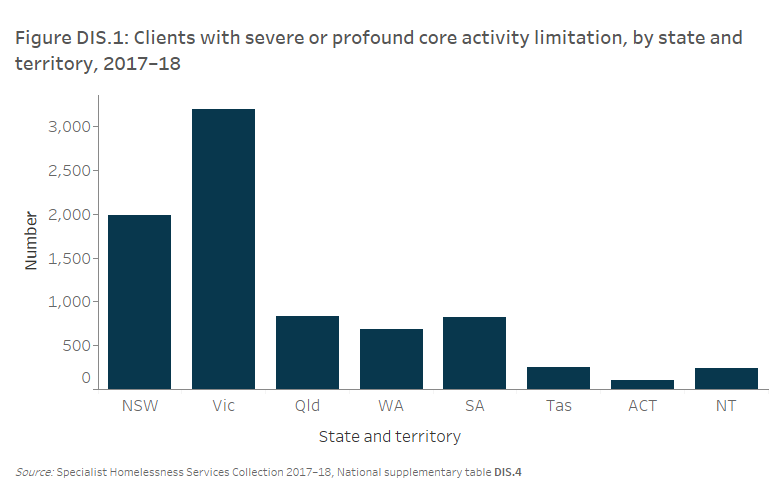
Almost 4 in 10 clients with severe or profound disability accessed SHS services in Victoria (39% or 3,200 clients). This was followed by New South Wales (24% or 2,000 clients), Queensland and South Australia (both 10% or around 800 clients) (Figure DIS.1).
In 2017–18, the Northern Territory had the highest rate of SHS clients with severe or profound disability (9.8 clients per 10,000 people), followed by Victoria (5.1 clients), while Queensland had the lowest rate (1.7 per 10,000 people) (Supplementary table DIS.4). Clients in Victoria received the most support periods on average (3.4 support periods per client), followed by Western Australia (2.3 support periods per client) and Tasmania (2.1 support periods per client).
Main source of income
In 2017–18, of clients aged 15 and over with severe or profound disability (over 4,700), 88% reported that their main source of income was a government payment, in particular:
- Disability Support Pension (49% compared with 16% of all SHS clients)
- Newstart Allowance (19% compared with 29% of all SHS clients)
- Age Pension (7% compared with 3% of all SHS clients)
- Parenting Payment (5% compared with 18% of all SHS clients).
A larger proportion of male clients with severe or profound disability (52%) reported that their main source of income was the Disability Support Pension, compared with females (47%). Males were also more likely to report the Newstart Allowance as their main source of income (22%), compared with females (17%).
Employment and education status
Of the 5,700 clients with severe or profound disability aged 15 and over:
- Over half were not in the workforce (59% or 3,200 clients). A further 37% (or 2,000 clients) were unemployed, that is, actively looking for work, which was lower than the SHS client population (48%) (Supplementary table DIS.14).
- 3% of these clients (or less than 200 clients) were employed. By comparison, 12% of the total SHS client population were employed.
- The proportion of clients aged 15–24 whose educational enrolment status was reported and who were not enrolled in education was similar to that of the general SHS client group (69% and 68% respectively) (Supplementary table DIS.16).
- 1 in 7 clients (14% or around 100 clients) aged 5–14 whose educational enrolment status was reported were not enrolled in education at the beginning of support, similar to the general SHS population (13%).
Source of referral
Similar to other SHS clients, most clients with severe or profound disability seek support from SHS agencies with a formal referral (67% or 5,300 clients). Both government and non-government agencies can make formal referrals including hospitals, family and child support agencies and mental health services. In 2017–18, referrals for clients with a severe or profound disability were most commonly made by:
- a specialist homelessness agency/outreach worker (17% or 1,300 clients)
- family and/or friends (7% or 600 clients)
- telephone/crisis referral agency (6% or over 400 clients).
An additional 1 in 10 (11% or over 800 clients) were referred by another agency (government or non-government).
Reasons for seeking assistance
The most common main reason this group of clients reported for seeking assistance was housing crisis (25%). Less than 1 in 5 (18%) reported the main reason they had sought assistance was for domestic and family violence, which was lower than the general SHS population (30%).
Services needed and provided
Clients with severe or profound core activity limitation were more likely to need some specific services than the general SHS client population; for example, mental health services (19% compared with 9%) and assistance to sustain housing tenure (45% compared with 33%). Considering housing needs of clients with a profound or severe disability in 2017–18:
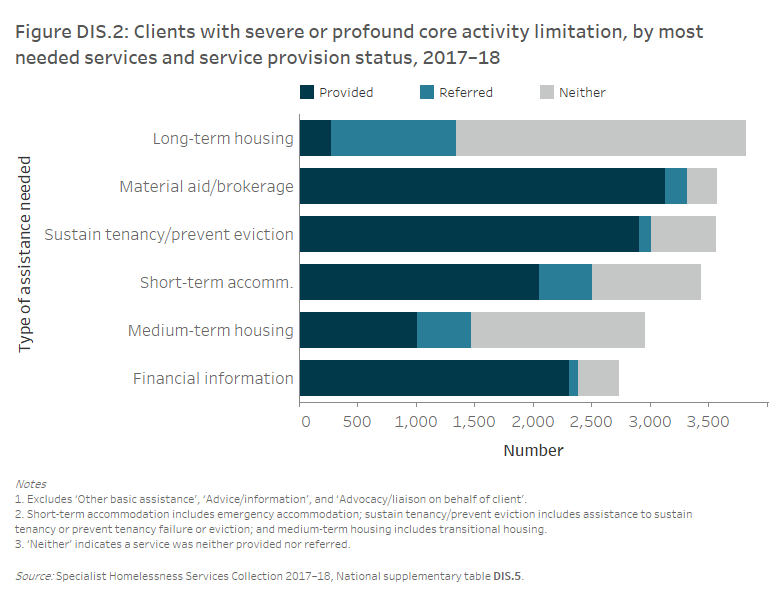
- Almost half needed long-term housing (48% or 3,800 clients), 37% (or 3,000 clients) needed medium-term/transitional housing and 44% (or 3,400 clients) needed short-term or emergency accommodation (Figure DIS.2).
- Most of those needing short-term or emergency accommodation received it (60% or 2,100 clients) while one-third (34% or 1,000 clients) of those needing medium-term/transitional housing received it. Less than 1 in 10 clients with severe or profound disability received the long-term housing needed (7% or less than 300 clients) (Figure DIS.2).
Other services that were needed by SHS clients with severe or profound disability:
- Many requested advice/information (83%), advocacy/liaison (68%) and material aid/brokerage (45%).
- 1 in 5 clients (22% or 1,700) needed health/medical services and over half (57%) of clients with these identified needs had these services provided. Less than 1 in 5 clients (17% or over 1,300) were identified as needing mental health services with half (53%) of these clients receiving these services (Supplementary Table DIS.5).
- 4% of clients (or about 300 clients) needed support and assistance specifically for their physical disability. Similarly, 4% (or over 300 clients) needed services specifically for their intellectual disability. Less than half (44% and 42% respectively) of these identified needs for disability services were met.
- Clients with severe or profound disability were more likely to need family relationship assistance (22% or over 1,700 clients), assistance with challenging social/behavioural problems (21%) and assistance for trauma (17%) than the general SHS population (18%, 13% and 12% respectively).
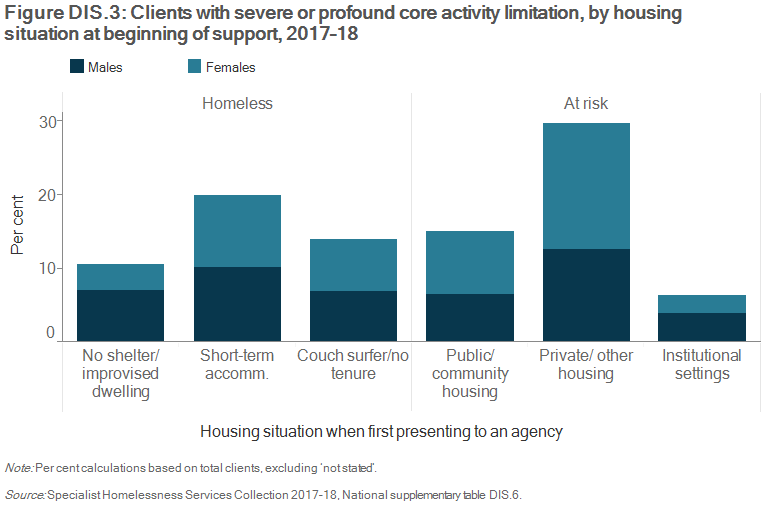
Housing situation at the start of support
Upon presentation to SHS agency in 2017–18, 54% of clients with severe or profound disability were housed but at risk of homelessness (Figure DIS.3). Of these, 30% were in private or other housing, 15% were in public or community housing and 6% in institutional settings. The remaining 46% of clients were homeless at the start of SHS support including 11% sleeping rough, 20% in short-term accommodation and 14% couch surfing.
The housing situation at the start of support for clients with severe or profound disability was broadly similar to the total population of SHS clients.
Housing and other outcomes
The outcomes presented in this section examines the changes in clients’ housing situations from the start to end of support. Only clients who ceased receiving support by the end of the financial year are included in this section—meaning their support periods had closed and they did not have ongoing support at the end of the 2017–18 reporting period. However, it is important to note that a proportion of these clients may seek assistance from SHS agencies again in the future.
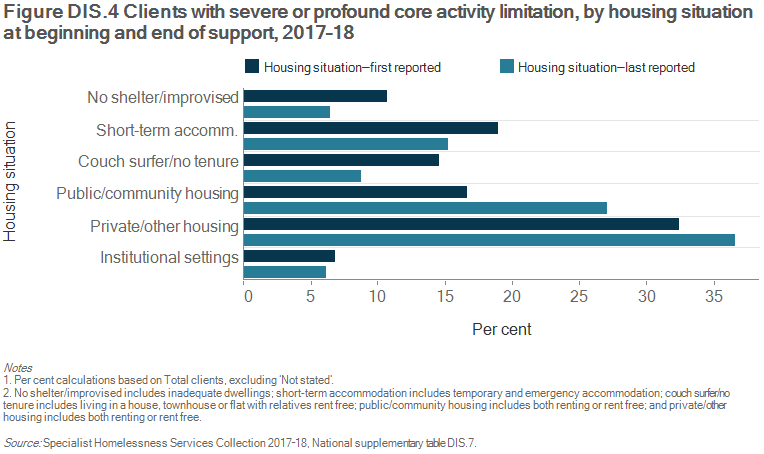
For clients with severe or profound disability (Figure DIS.4):
- More were living in public or community housing at the end of support, increasing from 17% of clients at the beginning of support to 27% at the end (from 800 to 1,300 clients).
- At the end of support more clients were living in private or other housing, increasing from 1,600 clients at the beginning of support (32%) to 1,800 clients (37%).
- The proportion who were couch surfing decreased from 15% (or 700 clients) at the beginning of support to 9% (or 400 clients) at the end of support.
Of those clients who were housed but at risk of homelessness at the beginning of support (that is, living in either public or community housing (renter or rent-free), private or other housing (renter or rent-free), or in institutional settings) (Table DIS.3):
- 9 in 10 clients (89% or 2,300 clients) were assisted to maintain their housing tenancy.
- Around 8 in 10 (82%) of those living in public or community housing remained in this housing. A further 7% of those in public or community housing moved into private or other housing at the end of support.
- Many of those (78%) living in private or other housing were assisted to maintain their tenancy with a further 10% assisted into public or community housing.
Of those clients who were homeless when they began SHS support; that is, living either with no shelter or improvised/inadequate dwelling, short-term temporary accommodation or in a house, townhouse or flat with relatives (rent-free) (Table DIS.3):
- Less than half were assisted (46% or 900 clients) into housing at the end of support.
- Agencies were best able to assist those living in short-term or emergency accommodation (53%) and those couch surfing (44%) into housing.
Table DIS.3: Clients with severe or profound core activity limitation, housing situation at beginning and end of support, 2017–18 (per cent)
| Situation at beginning of support | Situation at end of support: homeless | Situation at end of support: housing |
|---|---|---|
|
Homeless |
54.3 |
45.7 |
|
At risk of homelessness |
11.3 |
88.7 |
Notes
- The SHSC classifies clients living with no shelter or improvised/inadequate dwelling, short-term temporary accommodation, or in a house, townhouse, or flat with relatives (rent free) as homeless. Clients living in public or community housing (renter or rent free), private or other housing (renter or rent free), or in institutional settings are classified as housed.
- Proportions include only clients with closed support at the end of the reporting period. Per cent calculations are based on total clients, excluding ‘Not stated/other’.
Source: Specialist homelessness services 2017–18, National supplementary table DIS.7.
Education and employment status remained nearly unchanged following support. For example, there was little difference in the proportion of pre- and post-support clients who were unemployed (37% compared with 38%) or not in the labour force (59% compared with 58%).
Reference
- Australian Bureau of Statistics (ABS) 2016. Disability, ageing and carers, Australia. First Results, 2015. ABS cat. no. 4430.0. Canberra: ABS.