Policy framework for reducing homelessness and service response
Governments across Australia fund a range of services to support people who are homeless or who are at risk of homelessness. These services are delivered by non-government organisations including agencies specialising in delivering services to specific target groups (such as young people or people experiencing domestic violence), as well as those that provide more generic services to those facing housing crises.
Report scope
- Data about people who received assistance from specialist homelessness agencies in 2017–18, the type of assistance they received, and changes in their housing whilst receiving support and other circumstances.
- Changes in client characteristics, the services they received, and their outcomes, including over time.
- Data on people who requested services in 2017–18, but were not provided with support at that time.
In 2017–18, an Australian Defence Force (ADF) indicator was introduced into the Specialist Homelessness Services Collection (SHSC) to provide a better understanding of the extent to which veterans need and seek support from Specialist Homelessness Services (SHS) agencies. Initial results from the first year of implementation are presented. Data describing clients living with disability are presented from 2013–14 onwards.
The data in this publication are produced from the SHSC, which is conducted by the Australian Institute of Health and Welfare (AIHW). Data are provided to the AIHW by more than 1,500 homelessness agencies allowing this report to be compiled and published. The AIHW thanks the agencies and their clients for making this report possible.
People who are homeless or at risk of homelessness may also access a range of mainstream services that are available to the broader community (such as income support payments or health services). These services are not described in this report.
The policy framework for reducing homelessness
Many Australians experience events in their life that may place them at risk of homelessness. It is estimated that just over half (51%) of lower income households experience housing affordability issues due to rental stress (paying more than 30% of their gross income on housing costs) [1].
On Census night in 2016, 116,427 Australians were homeless, up from 102,439 people in 2011. This equates to a 4.6% increase in the rate of homeless persons over 5 years, from 47.6 per 10,000 population in 2011 to 49.8 in 2016. Census homeless estimates include people in supported accommodation for the homeless, people in temporary accommodation, those ‘sleeping rough’ and people living in severely crowded dwellings (those that required 4 or more extra bedrooms to accommodate the residents) [2].
It is important to note the challenges associated with observing people experiencing homelessness in any data collection. The Australian Bureau of Statistics acknowledges that the homeless circumstance may mean that some people are not captured at all in datasets, nor will all those experiencing homelessness be captured in datasets of those accessing particular homelessness services. In addition, certain groups of people (including Indigenous populations, rough sleepers and those in supported accommodation) are more likely to be undercounted on Census night. Hence, homelessness data collected in the Census is an estimation, and susceptible to under/overestimation and under enumeration [2].
In the 2017–18 Budget, the Federal Government announced the establishment of a new National Housing and Homelessness Agreement (NHHA), which came into effect on 1 July 2018. This agreement reformed previous funding agreements with states and territories (the National Affordable Housing Agreement (NAHA) supported by the National Partnership Agreement on Homelessness (NPAH)). The SHSC data in the 2017–18 annual report has been collected while the former NAHA and NPAH agreements were in place. The NHHA will provide $4.6 billion in Commonwealth funding to the states and territories over three years, including $375 million for homelessness services, which states will be required to match. Funding for homelessness services will be ongoing and indexed for the first time to provide certainty to front line services assisting Australians who are experiencing homelessness or who are at risk of homelessness [3].
Objective of the NHHA
The objective of the NHHA is to contribute to improving access to affordable, safe and sustainable housing across the housing spectrum, including to prevent and address homelessness, and to support social and economic participation. Several national priority cohorts have been specifically identified in the agreement and are expected to be addressed in each jurisdiction’s homelessness strategy:
- women and children affected by family and domestic violence
- children and young people
- Indigenous Australians
- people experiencing repeat homelessness
- people exiting institutions and care into homelessness
- older people.
In addition, several homelessness priority policy reform areas have been identified:
- achieving better outcomes for people
- early intervention and prevention
- commitment to service program and design.
About the Specialist Homelessness Services Collection
Homelessness agencies have supported more than 1 million clients since the collection began on 1 July 2011. The SHSC collects data from homelessness agencies funded under the NHHA (previously the NAHA and the NPAH). State and territory departments identify agencies that are expected to participate in the data collection. These agencies vary widely in terms of the services they provide and the service delivery frameworks they use. These frameworks may be determined by the state or territory funding department or developed as a response to local homelessness issues (see What are specialist homelessness agencies? for more details).
All SHSC agencies report standardised data about the clients they support each month to the AIHW, as specified in the SHS National Minimum Dataset (NMDS). Data are collected about the characteristics and circumstances of clients when they first present at an agency. Further data on assistance received and client circumstances are collected at the end of every month in which the client receives services and again when contact with the client has ceased.
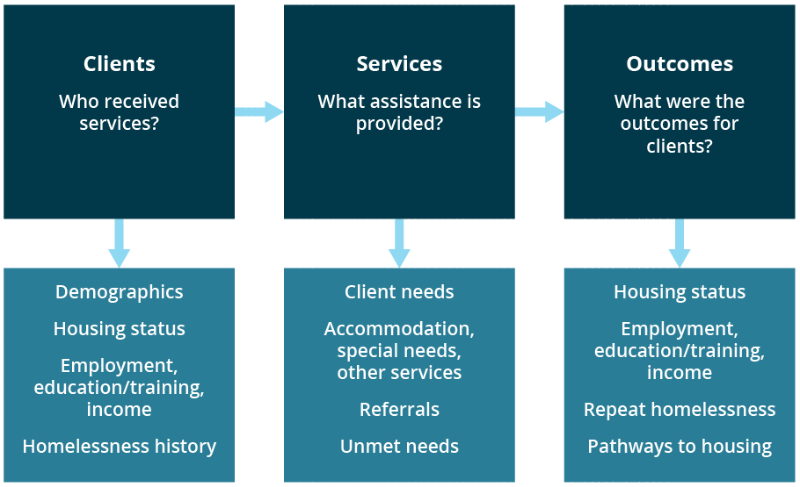
Data supplied in accordance with the SHS NMDS, known as the SHSC, builds a comprehensive picture of clients, the specialist homelessness services that were provided to them and the outcomes achieved for those clients (Figure FRAMEWORK.1). SHSC data provide a measure of the service response directed to those who are experiencing housing difficulty. The data do not provide a measure of the extent of homelessness in the community, although SHSC data on emergency accommodation and supported accommodation do contribute to the profile of homelessness in Australia.
Figure FRAMEWORK.1: Conceptual framework of the Specialist Homelessness Services Collection
The data collected by agencies are based on periods of support provided to clients. These support periods vary in terms of their duration, the number of contacts between SHS workers and clients, and the reasons that support ends. Some support periods are relatively short—and are likely to have begun and ended in 2017–18—while others are much longer, many of which might have been ongoing from the previous year and/or were still ongoing at the end of 2017–18.
Certain information collected about the client (selected letters of name, date of birth and sex) is used to construct a statistical linkage key (SLK). This SLK brings together all data about each client who had multiple support periods (either within the same agency or with different agencies) during the reporting year.
Data tables from which these analyses are drawn are provided as supplementary tables to this report. All percentages given are based on valid responses reported for clients, and the extent of missing data is indicated in the supplementary tables.
Further information about the collection and information about the quality of the data obtained through the SHSC for 2017–18 is available in Technical information.
Delivery of homelessness services across Australia
Each state and territory manages their own system for the assessment, intake, referral and ongoing case management of specialist homelessness services clients. Box FRAMEWORK.1 summarises the key delivery systems operating in Australia. Although presented as three distinct models, these systems are representative of a range of approaches jurisdictions may employ to coordinate entry into specialist homelessness services. Changes implemented by jurisdictions in the delivery of services and their associated responses have the potential to impact SHSC annual data.
Box FRAMEWORK.1
Community sector funding and support
- Assessment and intake: managed by individual SHS providers, consistent with state or territory policies.
- Referral: refer to other SHS providers if clients’ needs can’t be met by initial SHS provider.
- Can be supported by a coordinating service.
Central information management
- Assessment, intake and referral: managed at any SHS provider, via state or territory central information management tool.
- Central information management system assists in the identification of appropriate services and indicates the availability/vacancy of services at all SHS providers.
Central intake
- Assessment, intake and referral: managed by one or more ‘central intake’ agency.
- Central intake agencies prioritise access to services and only refer clients as services and/or vacancies are available.
- Central information management tool may exist to share information between SHS providers.
What are specialist homelessness agencies?
A specialist homelessness agency in scope for the SHSC is an organisation that receives government funding to deliver accommodation related and personal services to people who are homeless or at risk of homelessness. While it is recognised that other organisations not directly funded by the government also provide a wide range of services to this sector, these organisations are not required to provide data to the SHSC.
SHS agencies vary considerably in size and in the types of assistance they provide. Across Australia, agencies provide services aimed at prevention and early intervention, as well as crisis and post crisis assistance to support people experiencing or at risk of homelessness. For example, some agencies focus specifically on assisting people experiencing homelessness, while others deliver a broader range of services, including youth intervention services, domestic and family violence services and housing support services to those at risk of becoming homeless. The service types an agency delivers range from basic, short-term interventions such as advice and information, meals, and shower/laundry facilities through to more specialised, time intensive services such as financial advice and counselling and professional legal services (see Glossary for a complete list of service types).
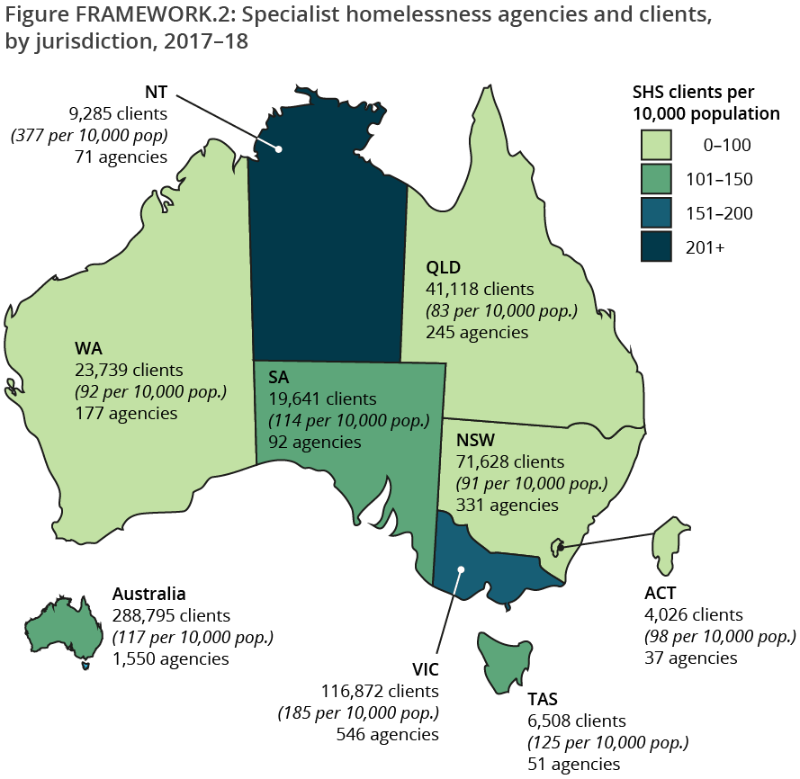
Nationally, there were 1,550 agencies that delivered specialist homelessness services to an estimated 288,795 clients during 2017–18 (Figure FRAMEWORK.2)
Notes
- Clients may access services in more than one state or territory, therefore the Australia total will be less than the sum of jurisdictions.
- The agency count includes only those agencies that provided support periods with valid SLKs.
- Due to improvements in the rates of agency participation and SLK validity, data are no longer weighted. The removal of weighting does not constitute a break in time series and weighted data from 2011–12 to 2016–17 are comparable with unweighted data for 2017–18. For further information please refer to the Technical notes.
Source: Specialist Homelessness Services Collection 2017–18.
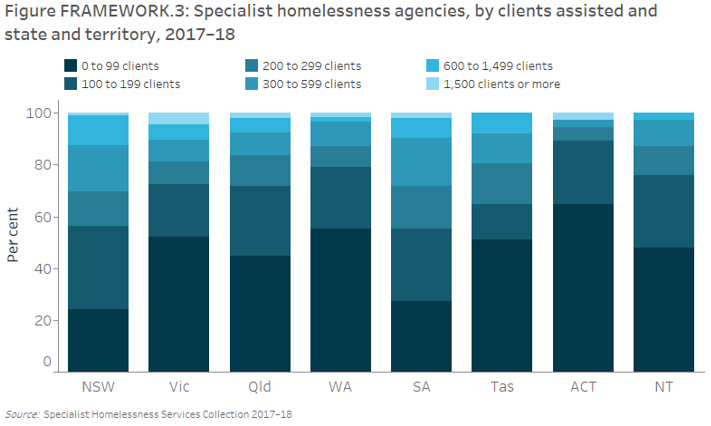
Agencies range considerably in size, with some agencies assisting up to 100 clients per year and others upward of 1,500. Some agencies are represented by a larger ‘parent’ organisation while others are individual stand-alone agencies. The number of clients agencies assist (agency size) not only reflects the type and complexity of services provided, but also differing state and territory service delivery models. Agency size is also influenced by jurisdictional specific factors such as the size and geographical distribution of their population. Figure FRAMEWORK.3 illustrates the wide range in agency sizes within each jurisdiction. In 2017–18, most agencies assisted fewer than 100 clients, except New South Wales and South Australia, ranging from 65% of agencies in the Australian Capital Territory to 45% in Queensland. In New South Wales and South Australia, a higher proportion of agencies assisted between 100–199 clients than fewer than 100 clients (32% compared with 24% for New South Wales and 28% compared with 27% for South Australia). Agencies assisting a large number of clients (more than 1,500 in 2017–18) exist in all jurisdictions except the Northern Territory and Tasmania. Victoria has the most agencies of this size (4% or 24 agencies).
SHS agencies and their service delivery
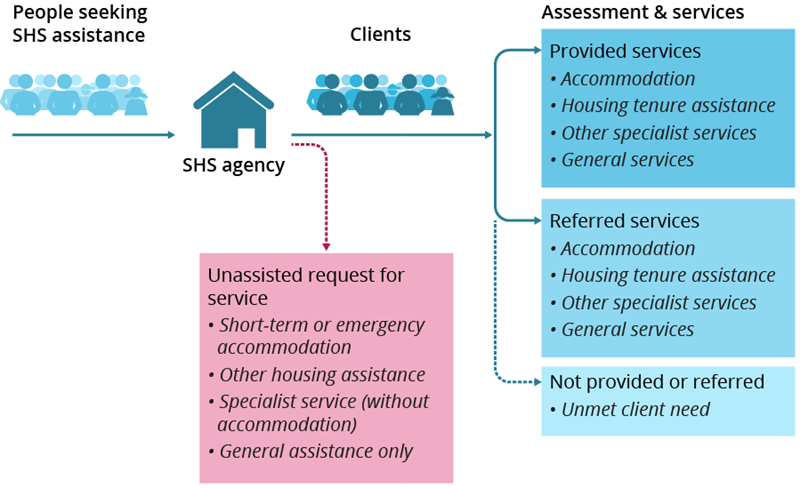
Specialist homelessness services can either be provided to the client by the agency, or a client may be referred to another agency for a specific service (Figure FRAMEWORK.4). In some instances, a client may not receive nor be referred for a service and their need remains unmet. These unmet needs are captured to assist in determining the ability of the sector to respond to client needs.
An ‘unassisted request for service’ is an instance where a person(s) who approaches an agency is unable to be provided with any assistance (see Technical information).
Figure FRAMEWORK.4: Access to and delivery of Specialist Homelessness Services
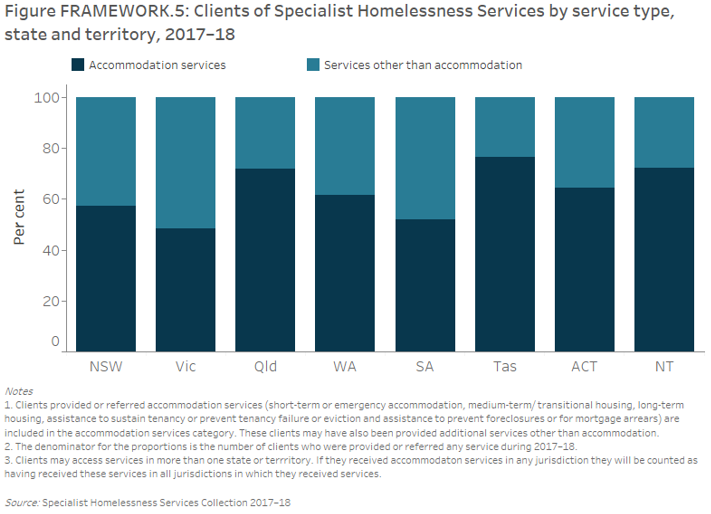
Services provided by specialist homelessness agencies in all jurisdictions can be categorised as either ‘accommodation services’ (either the direct provision of accommodation or assistance for the client to remain housed) or ‘services other than accommodation’ (Figure FRAMEWORK.5). The proportion of SHS clients receiving accommodation services varied across states and territories in 2017–18, with almost 8 in 10 clients in Tasmania (77%) and more than 7 in 10 clients in the Northern Territory (72%) and Queensland (72%) receiving these services (Figure FRAMEWORK.5). In contrast, 51% of clients in Victoria were provided services other than accommodation. This variation reflects differences in the demand for accommodation services, service delivery models, and housing options across jurisdictions.
References
- Australian Bureau of Statistics (ABS) 2017a. Housing and occupancy costs, 2015–16. ABS cat no. 4130.0. Canberra: ABS.
- ABS 2018. Census of population and housing: estimating homelessness, 2016. ABS cat no. 2049.0. Canberra: ABS.
- Council on Federal Financial Relations. National Housing and Homelessness Agreement.