Clients with problematic drug and/or alcohol use
Research suggests that prevalence of substance use disorders among people experiencing homelessness exceed general population estimates [1]. Research undertaken by the University of Melbourne for the Department of Social Services has demonstrated a strong association between substance use and homelessness, in particular current substance use behaviour and current state of homelessness [2]. Analysis of responses from The Journeys Home Survey indicate risky drinking and cannabis use were positively related to homelessness. While illegal street drugs and IV drug use were also positively related to homelessness, the association was not as strong [2].
Specialist homelessness services (SHS) clients aged 10 and over are identified with problematic drug and/or alcohol use if, at the beginning of or during support, the client provided any of the following information:
- recorded their dwelling type as rehabilitation facility
- required drug or alcohol counselling
- was formally referred to the SHS service from an alcohol and drug treatment service
- had been in a rehabilitation facility or institution during the past 12 months
- reported problematic drug, substance or alcohol use as a reason for seeking assistance or the main reason for seeking assistance.
Key findings in 2017–18
- Over 27,200 SHS clients (9%) had a problematic drug and/or alcohol use issue in 2017–18.
- Clients received more frequent support (3.0 support periods per client) over a longer period (median support length 86 days) than other client groups.
- More than 3 in 4 (78%) needed accommodation.
- Over 7 in 10 (72%) had received homelessness services in the 5 years prior to 2017–18.
- More than one-third (37%) identified a need for drug and/or alcohol counselling.
- The proportion of clients who presented to a SHS agency with ‘problematic drug or substance use’ as the main reason for seeking assistance was 6%; for ‘problematic alcohol use’, it was 3%.
- Of clients who had finished support, 45% ended support homeless, down from 56% at the start of support. The most common housing situation at the end of support was private or other housing (24%).
- Agencies assisted 8 in 10 clients (78%) with problematic drug and/or alcohol use who were at risk of homelessness to maintain a housing tenancy.
Profile of clients with problematic drug and/or alcohol use in 2017–18
In 2017–18, SHS agencies assisted 27,200 clients with problematic drug and/or alcohol use. Of these clients:
- More than half were male (54% or 14,600 clients). This is different to the overall SHS client profile, where most clients were female (61%).
- Almost 1 in 5 clients (19% or 5,000) were leaving or had recently left an alcohol and drug treatment rehabilitation facility when they first presented at a SHS agency.
- Almost 3 in 10 clients (29%) were Indigenous, compared with 23% in the overall SHS population.
- Over half of these clients (56%) were living alone.
- They were more likely to have received services in the past. Returning clients made up 72% (or 19,700) of this group, and the remaining 28% (or 7,500) were new clients. That is, more clients had received services at some point in the previous 5 years than those seeking assistance for the first time in 2017–18.
Vulnerabilities
Many clients who reported problematic drug and/or alcohol use were also facing additional challenges, which may make them more vulnerable to homelessness. Eight in 10 (80% or nearly 21,700) also reported additional vulnerabilities such as domestic and family violence and mental health issues (Table SUB.1).
Of SHS clients with problematic drug and/or alcohol use in 2017–18:
- 4 in 5 (80% or 21,700 clients) reported experiencing mental health issues and/or domestic and family violence.
- Almost 1 in 3 (29% or 7,900 clients) reported all three vulnerabilities.
- 1 in 5 (20% or 5,500 clients) reported none of these additional vulnerabilities; only problematic drug and/or alcohol use.
Table SUB.1: Clients with problematic drug and/or alcohol use, by selected vulnerability characteristics, 2017–18
|
Domestic and family violence |
Mental health issue |
Problematic drug and/or alcohol use |
Clients |
Per cent |
|---|---|---|---|---|
|
Yes |
Yes |
Yes |
7,900 |
29.0 |
|
Yes |
No |
Yes |
2,600 |
9.6 |
|
No |
Yes |
Yes |
11,200 |
41.3 |
|
No |
No |
Yes |
5,500 |
20.1 |
|
|
|
|
27,200 |
100 |
Notes
- Client vulnerability groups are mutually exclusive.
- Clients are aged 10 and over.
- Totals may not sum due to rounding.
Source: Specialist Homelessness Services Collection 2017–18.
Clients with problematic drug and/or alcohol use: 2013–14 to 2017–18
Since 2013–14, the number of clients presenting to services with problematic drug and/or alcohol use has risen from about 22,500 in 2013–14 to 27,300 clients in 2017–18. This group has consistently made up around 1 in 10 SHS clients for each of the past 5 years. Key trends identified in this client population over the 5 years to 2017–18 include (Table SUB.2):
- These clients have continued to be more likely than the general SHS population to be homeless on first presentation to agencies. This has remained at about 56% over the past 5 years, compared with 2 in 5 clients in the general SHS population.
- The service use rate for this group has remained constant at 11 clients per 10,000 population.
- This group of clients has consistently received more frequent SHS support, over a longer period, with more nights of accommodation provided than the general SHS population. This service use pattern suggests these clients present with complex needs.
- The proportion of these clients with a case management plan has remained high over time; however, those achieving all case management goals has remained low. This group remains one of the least likely of all SHS cohorts to meet all goals.
Table SUB.2: Clients with problematic drug and/or alcohol use: at a glance—2013–14 to 2017–18
|
|
2013–14 |
2014–15 |
2015–16 |
2016–17 |
2017–18 |
|---|---|---|---|---|---|
|
Number of clients |
23,253 |
24,225 |
26,505 |
27,295 |
27,158 |
|
Proportion of all clients |
9 |
9 |
9 |
9 |
9 |
|
Rate (per 10,000 population) |
10.0 |
10.3 |
11.1 |
11.3 |
11.0 |
|
Housing situation at the beginning of the first support period (proportion (per cent) of all clients) |
|||||
|
Homeless |
57 |
59 |
58 |
57 |
56 |
|
At risk of homelessness |
43 |
41 |
42 |
43 |
44 |
|
Length of support (median number of days) |
82 |
74 |
77 |
83 |
86 |
|
Average number of support periods per client |
2.6 |
2.7 |
2.9 |
2.9 |
3.0 |
|
Proportion receiving accommodation |
56 |
53 |
51 |
49 |
50 |
|
Median number of nights accommodated |
41 |
39 |
37 |
40 |
40 |
|
Proportion of a client group with a case management plan |
75 |
74 |
74 |
75 |
75 |
|
Achievement of all case management goals (per cent) |
14 |
16 |
13 |
13 |
14 |
Notes
- Rates are crude rates based on the Australian estimated resident population (ERP) at 30 June of the reference year. Minor adjustments in rates may occur between publications reflecting revision of the estimated resident population by the Australian Bureau of Statistics.
- The denominator for the proportion achieving all case management goals is the number of client groups with a case management plan. Denominator values for proportions are provided in the relevant national supplementary table.
- Data for 2013–14 to 2016–17 have been adjusted for non-response. Due to improvements in the rates of agency participation and SLK validity, 2017–18 data are not weighted. The removal of weighting does not constitute a break in time series and weighted data from 2013–14 to 2016–17 are comparable with unweighted data for 2017–18. For further information, please refer to the Technical notes.
-
In 2017–18, age and age-related variables were derived using a more robust calculation method. Data for previous years have been updated with the improved calculation method for age. As such, data prior to 2017–18 contained in the SHS Annual Report may not match that contained in the SHS Annual Report Historical Tables.
Source: Specialist Homelessness Services Collection 2017–18.
Source of referral
Around 1,400 clients with problematic drug and/or alcohol use (5%) were formally referred to a SHS agency by an alcohol and drug treatment service in 2017–18:
- The main source of formal referral to a SHS agency for clients with problematic drug and/or alcohol use was by another specialist homelessness agency or outreach worker (16% or 4,300 clients), followed by another government or non-government agency (10% or 2,800 clients).
- One-third of clients (33% or 8,800) had no formal referral to a SHS agency.
Housing situation
At the beginning of support, over half of clients were homeless (56% or about 15,200 clients). Over 2 in 5 (44% or 11,900) clients experiencing problematic drug and/or alcohol use were at risk of homelessness when first reporting to SHS agencies for assistance in 2017–18.
Reasons for seeking assistance
The main reasons for clients presenting with problematic drug and/or alcohol use were:
- housing crisis (25% compared with 21% of the overall SHS population)
- domestic and family violence (13% compared with 30%)
- inadequate/inappropriate dwelling conditions (12% compared with 10%).
The proportion of clients who presented to a SHS agency with ‘problematic drug or substance use’ as the main reason for seeking assistance was 6% while for ‘problematic alcohol use’, it was 3%.
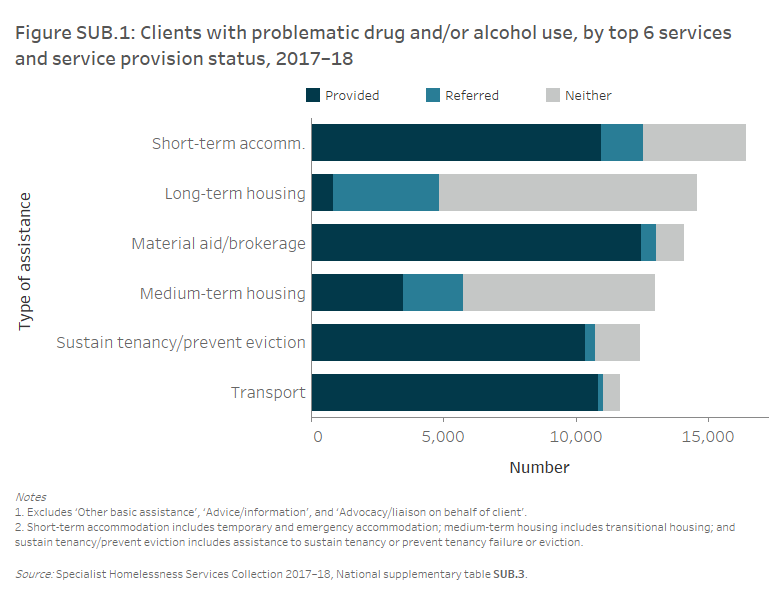
Services needed and provided
Of those clients with problematic drug and/or alcohol use in 2017–18, 37% (around 10,100 clients) identified a need for drug or alcohol based services (Figure SUB.1):
- almost half (48% or 4,800) of these requests were met
- almost 1 in 5 (18%) were referred to another agency
- over 1 in 3 (35%) went unmet (not provided or referred).
Compared with the general SHS population, clients with problematic drug and/or alcohol use were more likely to identify a need for:
- transport (43% compared with 20%)
- assistance with challenging social/behavioural problems (35% compared with 13%)
- living skills/personal development (42% compared with 20%).
Clients with problematic drug and/or alcohol use also identified needing:
- advice/information (92% or around 24,800 clients) with assistance provided to 99% of these clients
- advocacy/liaison on behalf of client (75% or nearly 20,200 clients) with assistance provided to 97% of these clients.
- material aid/brokerage (52% or 14,100 clients) with assistance provided to 89% of these clients.
The services which were least likely to be provided to clients with problematic drug and/or alcohol use were:
- long-term housing (54% or around 14,600 clients needed assistance) with assistance provided to 6% of these clients
- medium-term/transitional housing (48% or around 13,000 needed assistance) with assistance provided to 27% of these clients
- psychological services (12% or around 3,000 needed assistance) with assistance provided to 37% of these clients.
Housing outcomes
The outcomes presented in this section examine the changes in clients’ housing situations from the start of support to the end of support. Only clients who ceased receiving support by the end of the financial year are included in this section—meaning their support periods had closed and they did not have ongoing support at the end of the 2017–18 reporting period. However, it is important to note that a proportion of these clients may seek assistance from SHS agencies again in the future.
For clients with problematic drug and/or alcohol use (Figure SUB.2):
- The proportion of clients who were homeless at presentation to a SHS agency decreased from 57% (or 9,600 clients) to 46% (or 7,100) by the end of support, with 21% (or 3,200) in short-term or emergency accommodation at the end of support.
- Around 3,800 clients (24%) were in private or other housing following support, increasing from 3,100 (18%) at the commencement of support.
- Around 3,200 clients (20%) were living in public or community housing following support, increasing from 1,900 (11%) at the commencement of support.
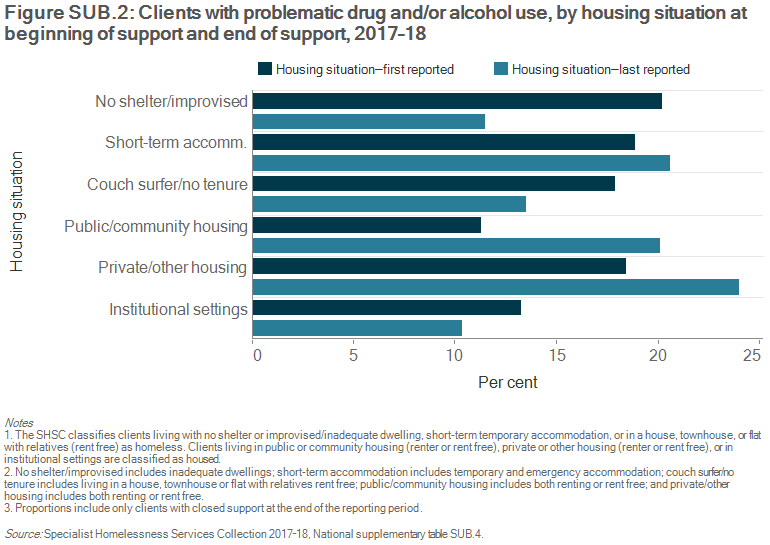
Of those clients with problematic drug and/or alcohol use who were housed but at risk of homelessness when they began support; that is, living either in public or community housing (renter or rent-free), private or other housing (renter or rent-free) or in institutional settings (Supplementary Table SUB.4):
- 78% (or 5,000 clients) were assisted to maintain their housing at the end of support.
- For those clients living in public or community housing at the start of support, 3 in 4 (75% or 1,300 clients) were assisted to maintain their tenancy while 7% (or 120 clients) moved into private or other housing.
- For clients living in private or other housing, 1 in 3 (66% or 1,900 clients) were assisted to maintain their tenancy while 9% (or 250 clients) moved into public or community housing.
Of those clients with problematic drug and/or alcohol use who were homeless when they began support; that is, living either with no shelter or improvised/inadequate dwelling, short-term or emergency accommodation or in a house, townhouse, or flat with relatives (rent-free) (Supplementary Table SUB.4):
- 37% (or 3,100 clients) were assisted into housing at the end of support.
- Of those who began support in short-term or emergency accommodation, 44% (or nearly 1,200 clients) were housed at the end of support.
- Of those who began support rough sleeping, 31% (or almost 900 clients) were housed at the end of support.
Table SUB.3: Clients with problematic drug and/or alcohol use, housing situation at beginning and end of support, 2017–18 (per cent)
| Situation at beginning of support | Situation at end of support: homeless | Situation at end of support: housed |
|---|---|---|
|
Homeless |
62.9 |
37.1 |
|
At risk of homelessness |
22.3 |
77.7 |
Notes
- The SHSC classifies clients living with no shelter or improvised/ inadequate dwelling, short-term temporary accommodation, or in a house, townhouse, or flat with relatives (rent-free) as homeless. Clients living in public or community housing (renter or rent-free), private or other housing (renter or rent-free), or in institutional settings are classified as housed.
- Proportions include only clients with closed support at the end of the reporting period. Per cent calculations are based on total clients, excluding ‘Not stated/other’.
Source: Specialist Homelessness Services Collection 2017–18, National supplementary table SUB.4.
References
- Flatau P, Conroy E, Clear A & Burns L 2010. The integration of homelessness, mental health and drug and alcohol services in Australia. AHURI Positioning Paper No. 132. Melbourne: Australian Housing and Urban Research Institute.
- Bevitt A, Chigavazira A, Herault N, Johnson G, Moschion J, Scutella R, Tseng Y-P, Wooden M & Kalb G 2015. Journeys Home Research Report No. 6: Complete findings from Waves 1 to 6. Melbourne: Melbourne Institute of Applied Economic and Social Research.
- AIHW (Australian Institute of Health and Welfare) 2016. Exploring drug treatment and homelessness in Australia: 1 July 2011 to 30 June 2014. Cat. no. CSI 23. Canberra: AIHW.