Unmet demand for specialist homelessness services
Specialist homelessness services (SHS) agencies in Australia provide assistance to thousands of people each day. On average, an estimated 62,000 people were supported each day in 2017–18. However, there were also people who approached agencies who were unable to be offered any assistance. These people may have approached more than one agency or returned to the same agency another day. An instance where no assistance is received by a person who approaches a service is referred to as an ‘unassisted request for service’. A limited amount of data are collected about these instances.
There may be a range of reasons an agency cannot assist a person. For example, the person may be seeking a specialised service not offered by that particular agency, the agency may not have the capacity to provide assistance at that time or the person may not be in the target group for the agency. See Technical notes and Glossary for information on the way in which unassisted requests for services are measured in the Specialist Homelessness Services Collection (SHSC).
Unmet demand data is presented from 2 perspectives:
- Unassisted requests for services relate to people who are not able to be offered any assistance by the SHS agency.
- Unmet need captures those clients who had some but not all of their identified needs met by the agency.
The SHSC captures limited information about unassisted requests for services (that is, point 1 above) as it is not always appropriate for SHS agencies to collect the same level of detailed information as they would if the person became a client.
1. Unassisted requests for services
Key findings
- In 2017–18, on average, there were 236 requests per day which were unable to be met; a total of 86,100 unmet requests for 2017–18, 9,300 fewer than in 2016–17 (95,400).
- Almost 3 in 4 daily unassisted requests included a need for some type of accommodation support (74%).
- Most commonly, agencies were unable to meet requests for accommodation because there was no accommodation available at the time.
- The majority of unassisted requests for assistance came from females (66%).
Some key trends in unmet demand since 2013–14 have been:
- The number of unassisted requests has varied over time (Table UNASSISTED.1). The decrease in unassisted requests in 2017–18 was primarily due to reductions in Western Australia and Victoria. For further details, see the data quality information in the Technical information section.
- Two-thirds of the unassisted requests were from females (66%) in 2017–18, up from 59% in 2013–14.
- In contrast to the changes occurring in the number of unassisted requests for services, the number of clients (that is, those who were assisted) and the number of support periods increased over the same period.
|
|
2014–15 Assisted Clients |
2014–15 Unassisted requests |
2015–16 Assisted Clients |
2015–16 Unassisted requests |
2016–17 Assisted Clients |
2016–17 Unassisted requests |
2017–18 Assisted Clients |
2017–18 Unassisted requests |
|---|---|---|---|---|---|---|---|---|
|
Number |
255,657 |
119,910 |
279,196 |
100,302 |
288,273 |
95,392 |
288,795 |
86,103 |
|
Sex (per cent): |
59 |
65 |
59 |
64 |
60 |
66 |
61 |
66 |
|
Sex (per cent): Male |
41 |
35 |
41 |
36 |
40 |
34 |
39 |
34 |
|
Living arrangement (per cent) |
||||||||
|
Lone person |
29 |
63 |
29 |
63 |
29 |
60 |
30 |
58 |
|
Sole parent |
34 |
33 |
34 |
33 |
35 |
35 |
35 |
37 |
|
Couple with child(ren) |
13 |
0 |
13 |
0 |
13 |
0 |
12 |
0 |
|
Couple without children |
5 |
2 |
5 |
2 |
5 |
2 |
5 |
2 |
|
Other family group |
18 |
2 |
18 |
2 |
18 |
3 |
18 |
3 |
Note: Data for 2014–15 to 2016–17 have been adjusted for non-response. Due to improvements in the rates of agency participation and SLK validity, 2017–18 data are not weighted. The removal of weighting does not constitute a break in time series and weighted data from 2014–15 to 2016–17 are comparable with unweighted data for 2017–18.
Source: Specialist Homelessness Services Collection 2014–15 to 2017–18.
Unassisted requests and future service use
Analysis of how often a person requested assistance and how many later became clients of SHS agencies can only be examined and understood where the statistical linkage key (SLK) was complete and valid (just over half (52%) of all unassisted requests). In 2017–18, on average, each person who was not assisted approached an agency 1.5 times, the same average as in 2016–17.
In 2017–18, 47% of people with a valid SLK later went on to become clients and received services during the year, similar to the proportion in 2016–17 (46%). The outcomes for the remaining 53% were not known; they may have received assistance from a non-SHS service, used their own support networks or continued to experience unstable housing.
Number of unassisted requests for services
Across Australia, on average, there were 236 requests per day that could not be met in 2017–18 (Figure UNASSISTED.1):
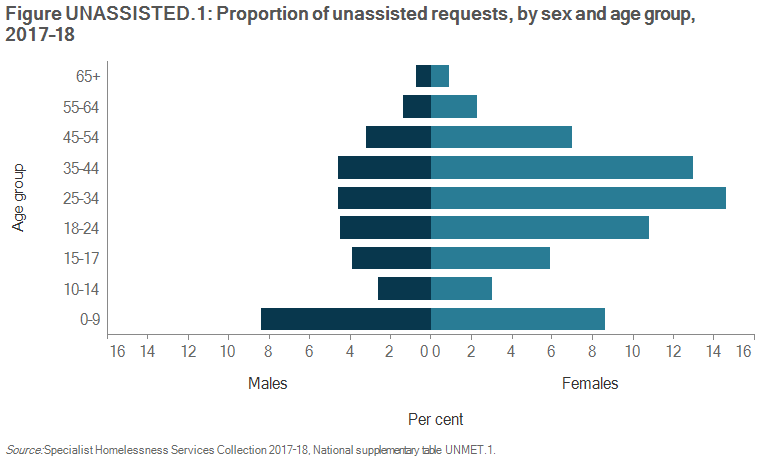
- Two-thirds of these requests came from females. About 156 daily unassisted requests (or 66% of all requests) were made by females and 80 by males (34%). This reflects the overall SHS client population, which is predominantly female.
- 1 in 4 (28%) unassisted requests were from females aged 25–44.
- 4 in 5 unassisted requests from single adults with children were from females (78%), and most of these females were aged between 25 and 44 (56% of adult single females with children).
Compared with 2016–17, in 2017–18:
- The number of unassisted requests fell for both sexes (about 1,900 fewer unassisted requests for males and 2,700 fewer for females).
- The largest decrease for females was in the group aged 18–24 presenting to an agency alone, not as part of a family. For males, it was also among the group aged 18–24 presenting alone.
What services were requested?
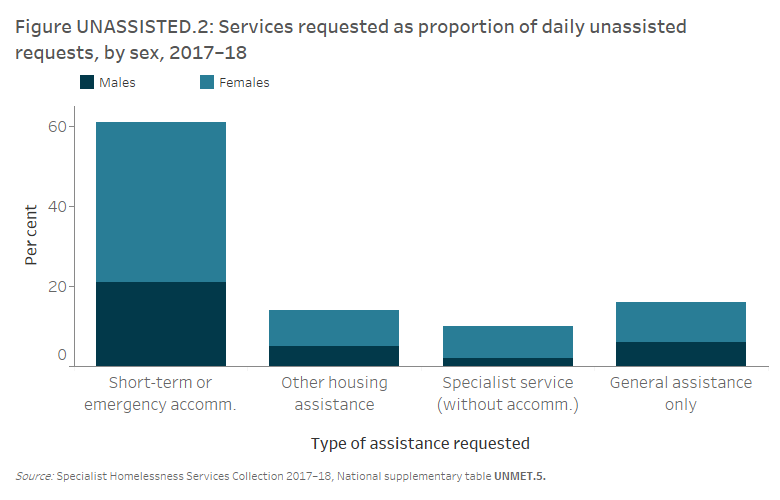
On average, 74% of daily unassisted requests included a need for some type of accommodation support:
- The majority of unassisted daily accommodation requests related to short-term or emergency accommodation (61%) (Figure UNASSISTED.2). Females were more likely than males to have requests for short-term or emergency accommodation unmet (66% and 34% respectively).
- Unassisted requests for short-term or emergency accommodation were lower than in 2016–17. There was, on average, 12 fewer unmet requests per day for this type of assistance.
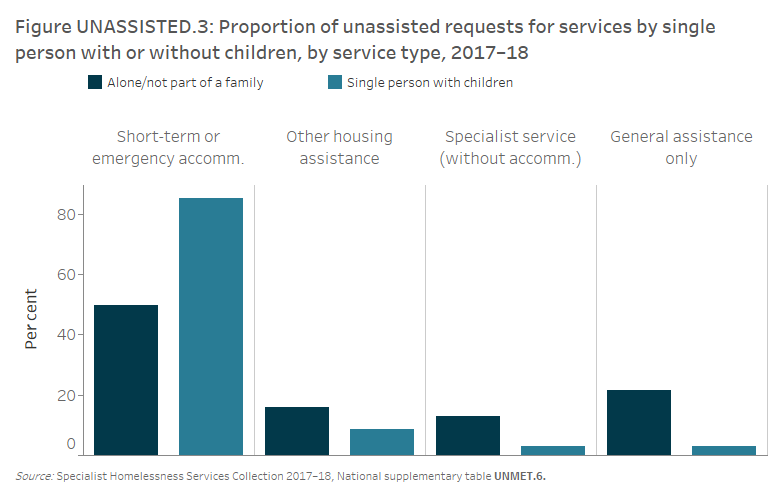
More than 9 in 10 (94%) daily unassisted requests for services from single persons with children were for accommodation needs, compared with 66% for single persons without children (Figure UNASSISTED.3).
Most commonly, agencies reported that they could not meet requests for any accommodation because there was no accommodation available at the time of the request (45% of unmet requests for accommodation) (Supplementary table UNMET.7). This figure is similar to 2016–17 (48%). On fewer than 1 in 10 occasions, a person did not accept the service offered (9%).
2. Clients’ unmet need for services
Clients seeking support from SHS agencies often need a wide range of services. Some needs arise more than once in a support period, and this makes it difficult to assess the extent to which the need has been met from the available data. In this section, each client need and the services provided to meet that need are only identified once in each support period. Clients may have also been referred to another service for assistance. This information is not included here.
Key findings in 2017–18
- Long-term housing options were provided to 5% (or 5,200) of the 104,600 (36%) clients needing this service.
- The ability of agencies to keep up with the demand for certain specialist services is line with the previous year. For example, 1 in 3 (32%) mental health service requests were neither provided nor referred in 2017–18, similar to that for 2016–17 (33%). Clients needing mental health services grew by 2% (or over 600 clients).
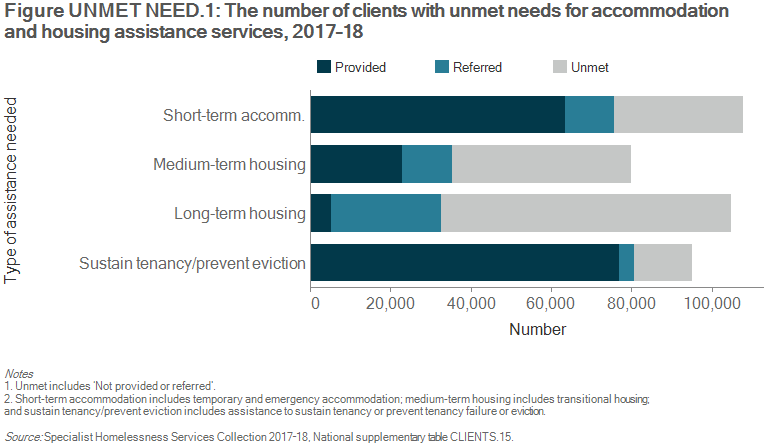
Unmet need for accommodation and housing assistance services
Accommodation was the most common need identified. In 2017–18, over half (56%) of all clients needed at least 1 type of accommodation service (Figure UNMET NEED.1):
- Nearly 2 in 5 clients (37% or 107,600 clients) needed short-term or emergency accommodation; 6 in 10 (59%) of those requesting this service were provided with assistance.
- One-third of clients (36% or 104,600 clients) identified a need for long-term housing; about 5% (or 5,200 clients) of these clients were provided with this service.
- The numbers of clients requesting either short-term or emergency accommodation or long-term housing were similarly large; however, the difference in the proportions of clients receiving these types of accommodation highlights the substantial unmet need for long-term housing encountered by SHS clients.
Client unmet need for general and specialised services
Some types of needs were able to be met by the agency for a significant proportion of clients. For example, of the nearly 225,000 clients who needed advice/information, 98% were provided assistance, and of the 155,000 clients requesting advocacy/liaison, 96% were provided with assistance (Supplementary table CLIENTS.15).
Other types of client needs were less commonly met. For example, among those clients who required legal services (3%, or almost 9,800 clients), the level of unmet need was substantial, around 28% at the end of support. This may be related to the specialist skills required to provide legal services and the limited availability of these skills within the SHS agencies and other services that clients may be referred to.
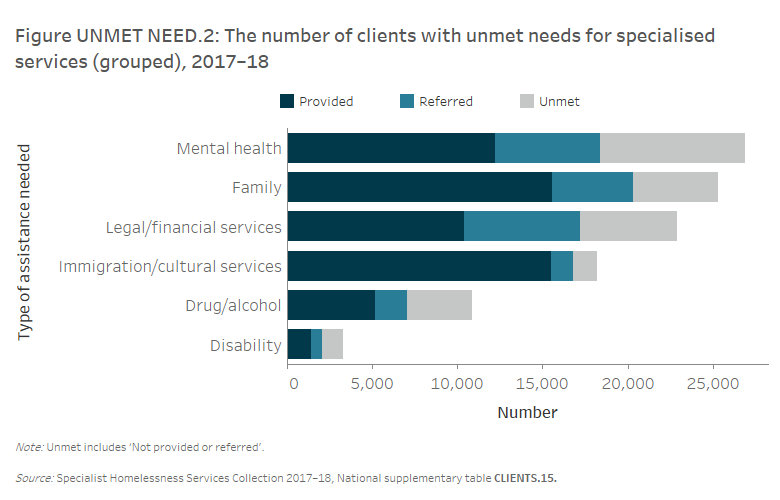
The level of unmet need for broad groups of specialised services can be determined (Figure UNMET NEED.2):
- Mental health services, including psychological, psychiatric and mental health services, were one of the most common specialised services identified as needed by clients; however, these needs were frequently unmet with around 3 in 10 clients (32%) neither provided nor referred these services.
- Similarly, over one-third of the clients identifying a need for disability services (37%) or drug and alcohol services (35%) did not have their needs met, however, overall, these services were less needed that mental health services.
- Immigration and cultural services, which were needed by 6% of SHS clients (about 18,200 people), were provided for most requiring them (85%).