Clients exiting custodial arrangements
Finding suitable and stable accommodation is a major concern for people exiting custodial arrangements, especially for those with little or no support networks, such as from family and friends [1]. People who exit custodial settings are recognised as being at increased risk of homelessness; they are also less likely to exit homelessness [2]. The ability to secure stable housing may reduce the likelihood of reoffending [3]. People exiting institutions and care are a national priority cohort identified in the National Housing and Homelessness Agreement (NHHA) [4], which came into effect on 1 July 2018.
For the purposes of the Specialist Homelessness Services Collection (SHSC), a client is identified as transitioning from a custodial setting if they are aged 10 years or older and have provided any of the following in their first support period in 2017–18:
- their dwelling type was adult correctional facility, youth or juvenile detention centre or immigration detention centre
- they reported ‘transition from custodial arrangements’ as a reason for seeking assistance
- their formal referral source to the Specialist Homeless Service (SHS) was youth or juvenile correctional centre or adult correctional facility.
Key findings in 2017–18
- In 2017–18, 8,300 people were identified as clients exiting from a custodial setting.
- Two-thirds (66% or 5,500) of clients were exiting adult correctional facilities.
- The majority of clients who exited custodial settings were male (76% or 6,300).
- Over two-thirds (69% or 5,700) of clients were living alone when they sought assistance from SHS, the highest rate of all SHS client groups.
- Two-thirds of clients (68% or 5,600) had received homelessness services at some time in the previous 5 years.
Profile of clients exiting custodial arrangements in 2017–18
Of the 8,300 clients exiting custodial arrangements in 2017–18:
- Over one-quarter identified as Indigenous (27% or 2,200), higher than the overall SHS population (25% Indigenous).
- Over 3 in 4 (76% or 6,300) clients were male.
- Two-thirds of clients (69% or 5,700) were living alone when they presented at a SHS agency.
- Over 2 in 3 (68% or 5,600) clients were returning clients, that is, they had presented at a SHS agency at least once in the past 5 years.
Vulnerabilities
Three of the main vulnerabilities reported in the SHS client population are mental health issues, domestic and family violence, and problematic drug and/or alcohol use. Over 3 in 5 (61% or about 5,100) clients exiting custodial arrangements reported at least one of these vulnerabilities (Table EXIT.1).
Of clients exiting custodial arrangements, the most common reported vulnerability was mental health issues (46% or about 3,900 clients) and of these clients, around 1 in 3 also had problematic drug and/or alcohol use. That is:
- 15% (or 1,300 clients) were experiencing both mental health and problematic drug and/or alcohol use.
- A further 7% (or 600 clients) were experiencing all three vulnerabilities.
Almost 2 in 5 (39% or 3,300 clients) reported none of these vulnerabilities.
Table EXIT.1: Clients exiting custodial arrangements, by selected vulnerability characteristics, 2017–18
|
Domestic and family violence |
Mental health issue |
Problematic drug and/or alcohol use |
Clients |
Per cent |
|---|---|---|---|---|
|
No |
Yes |
No |
1,700 |
20.6 |
|
No |
Yes |
Yes |
1,300 |
15.3 |
|
No |
No |
Yes |
800 |
9.3 |
|
Yes |
No |
No |
270 |
3.2 |
|
Yes |
Yes |
No |
300 |
3.5 |
|
Yes |
No |
Yes |
200 |
2.0 |
|
Yes |
Yes |
Yes |
600 |
6.8 |
|
No |
No |
No |
3,300 |
39.1 |
|
|
|
|
8,300 |
100 |
Notes
- Client vulnerability groups are mutually exclusive.
- Clients are aged 10 and over.
- Totals may not sum due to rounding.
Source: Specialist Homelessness Services Collection 2017–18.
Clients exiting custodial arrangements: 2013–14 to 2017–18
Since 2013–14, the number of people exiting custodial arrangements and seeking assistance from specialist homelessness services has been increasing. Key trends identified in this client population over the 5 years to 2017–18 (Table EXIT.2) include:
- The number of clients has grown each year, from 6,800 in 2013–14 to 8,300 in 2017–18.
- The proportion of clients achieving all case management goals has doubled, from 11% in 2013–14 to 22% in 2017–18.
- The proportion of clients receiving accommodation has declined from 40% in 2013–14 to 37% in 2017–18.
- The median number of nights accommodated has also decreased, from 28 in 2013–14 to 22 in 2017–18.
Table EXIT.2: Clients exiting custodial arrangements: at a glance—2013–14 to 2017–18
|
|
2013–14 |
2014–15 |
2015–16 |
2016–17 |
2017–18 |
|---|---|---|---|---|---|
|
Number of clients |
6,756 |
6,866 |
7,804 |
8,118 |
8,338 |
|
Proportion of all clients |
3 |
3 |
3 |
3 |
3 |
|
Rate (per 10,000 population) |
2.9 |
2.9 |
3.3 |
3.4 |
3.4 |
|
Housing situation at the beginning of the first support period (proportion (per cent) of all clients) |
|||||
|
Homeless |
27 |
31 |
31 |
32 |
34 |
|
At risk of homelessness |
73 |
69 |
69 |
68 |
66 |
|
Length of support (median number of days) |
53 |
45 |
44 |
45 |
49 |
|
Average number of support periods per client |
1.8 |
1.8 |
1.9 |
1.9 |
1.9 |
|
Proportion receiving accommodation |
40 |
41 |
38 |
35 |
37 |
|
Median number of nights accommodated |
28 |
27 |
26 |
28 |
22 |
|
Proportion of a client group with a case management plan |
53 |
50 |
52 |
53 |
53 |
|
Achievement of all case management goals (per cent) |
11 |
16 |
17 |
18 |
22 |
Notes
- Rates are crude rates based on the Australian estimated resident population (ERP) at 30 June of the reference year. Minor adjustments in rates may occur between publications reflecting revision of the estimated resident population by the Australian Bureau of Statistics.
- The denominator for the proportion achieving all case management goals is the number of client groups with a case management plan. Denominator values for proportions are provided in the relevant national supplementary table.
- Data for 2013–14 to 2016–17 have been adjusted for non-response. Due to improvements in the rates of agency participation and SLK validity, 2017–18 data are not weighted. The removal of weighting does not constitute a break in time series and weighted data from 2013–14 to 2016–17 are comparable with unweighted data for 2017–18. For further information, please refer to the Technical Notes.
-
In 2017–18, age and age-related variables were derived using a more robust calculation method. Data for previous years have been updated with the improved calculation method for age. As such, data prior to 2017–18 contained in the SHS Annual Report may not match that contained in the SHS Annual Report Historical Tables.
Source: Specialist Homelessness Services Collection 2013–14 to 2017–18.
Housing situation
At the beginning of support, the majority of clients exiting custodial arrangements were at risk of homelessness (66% or about 5,500 clients); that is, in public or community housing (renter or rent free), private or other housing or an institutional setting. One in 3 (34% or 2,800) clients exiting custodial arrangements were homeless when first reporting to SHS agencies for assistance in 2017–18.
Reasons for seeking assistance
The main reasons clients exiting custodial arrangements sought assistance were transition from custodial arrangements (61% or 5,000 clients), housing crises (13%), inadequate or inappropriate dwelling conditions (5%), and financial difficulties (3%).
Services needed and provided
Around 6,100 clients exiting custodial arrangements needed assistance with accommodation (73%). Of these clients, 50% were provided with assistance.
- For clients needing short-term or emergency accommodation (55% or 4,600), more than half (55%) were provided with assistance.
- For clients needing long-term housing (49% or 4,100), 4% were provided with assistance.
- Of the 3,200 clients (38%) needing assistance to sustain tenancy or prevent tenancy failure or eviction, 86% (or 2,700) received this assistance.
Certain services were requested by clients exiting custodial arrangements more frequently than by the overall SHS population. Some of these include:
- short-term or emergency accommodation (55%, compared with 37% of the overall SHS population)
- long-term housing (49%, compared with 36%)
- medium-term/transitional housing (40%, compared with 28%)
- advocacy/liaison on behalf of client (64%, compared with 54%)
- drug/alcohol counselling (12%, compared with 4%).
Housing outcomes
The outcomes presented in this section examine the changes in clients’ housing situations from the start of support to the end of support. Only clients who ceased receiving support by the end of the financial year are included in this section—meaning their support periods had closed and they did not have ongoing support at the end of the 2017–18 reporting period. However, it is important to note that a proportion of these clients may seek assistance from SHS agencies again in future.
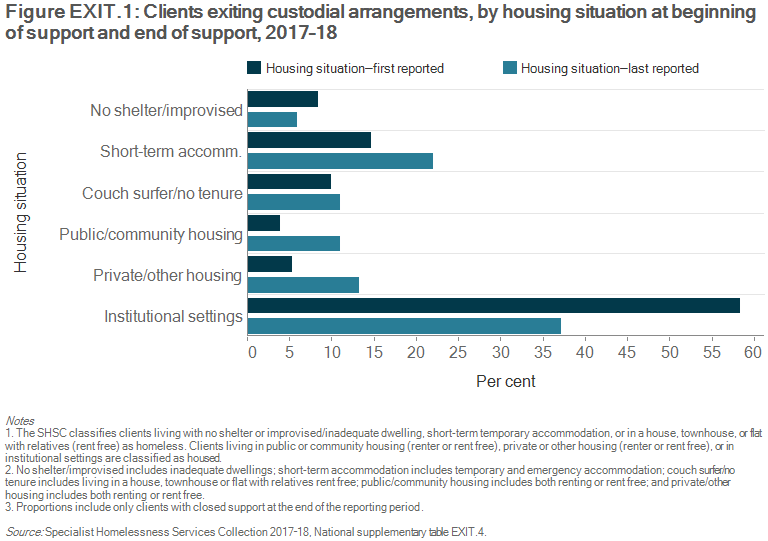
For clients exiting custodial arrangements in 2017–18 (Figure EXIT.1):
- The proportion of clients who reported living in institutional settings decreased to 37% (or 2,000 clients) following support; down from 58% (3,500) at the beginning of support.
- Over 1 in 5 (22% or 1,200 clients) were housed in short-term or emergency accommodation at the end of support, up from 15% (or 900 clients) at the beginning of support.
- The proportion of clients living in private or other housing (as a renter, rent free or owner) more than doubled from the beginning of support (5% or 300 clients) to the end of support (13% or 700 clients).
Of those clients who were housed, but at risk of homelessness at the beginning of support (that is, living in either public or community housing (renter or rent free), private or other housing (renter or rent free), or in institutional settings (Table EXIT.3):
- 3 in 4 (75% or 2,700 clients) were housed at the end of support, mostly in institutional settings (52% or 1,900 clients).
- over 2 in 3 clients (67% or 150 clients) living in public or community housing were assisted to maintain this tenancy and a further 10% were assisted into private or other housing at the end of support.
- those living in private or other housing were assisted to maintain their tenancy, with 70% (or 200 clients) still in private or other housing and a further 7% in public or community housing at the end of support.
Of those clients who were homeless (that is, living either with no shelter or improvised/inadequate dwelling, short-term or emergency accommodation, or in a house, townhouse, or flat with relatives (rent free)) when they began SHS support (Table EXIT.3):
- the majority remained homeless (66% or 1,100 clients) at the end of support compared with 34% (or 580 clients) who were housed at the end of support.
- agencies were best able to assist those living in short-term or emergency accommodation into housing (37% or 280 clients) with 14% (or 110 clients) assisted into private/other housing and 13% (or 100 clients) assisted into public or community housing.
Table EXIT.3: Clients exiting custodial arrangements, housing situation at beginning and end of support, 2017–18 (per cent)
| Situation at beginning of support | Situation at end of support: homeless | Situation at end of support: housed |
|---|---|---|
|
Homeless |
66.2 |
33.8 |
|
At risk of homelessness |
25.0 |
75.0 |
Notes
- The SHSC classifies clients living with no shelter or improvised/ inadequate dwelling, short-term temporary accommodation, or in a house, townhouse, or flat with relatives (rent free) as homeless. Clients living in public or community housing (renter or rent free), private or other housing (renter or rent free), or in institutional settings are classified as housed.
- Proportions include only clients with closed support at the end of the reporting period. Per cent calculations are based on total clients, excluding ‘Not stated/other’.
Source: Specialist Homelessness Services Collection 2017–18. National supplementary table EXIT.4.
References
1. Woodall J, Dixey R & South J 2013. Prisoners’ perspectives on the transition from the prison to the community: implications for settings-based health promotion. Critical Public Health 23:188–200.
2. Johnson G, Scutella R, Tseng Y, & Wood G 2015. Entries and exits from homelessness: a dynamic analysis of the relationship between structural conditions and individual characteristics. AHURI Final Report No. 248, Australian Housing and Urban Research Institute Limited, Melbourne.
3. Australian Government. 2008. The road home: a national approach to reducing homelessness. Canberra: Commonwealth of Australia.
4. Council on Federal Financial Relations 2018. National Housing and Homelessness Agreement.