Client geography
The rate at which people access homelessness services can vary geographically due to service availability and region-specific factors such as housing availability and affordability. This section examines people seeking specialist homelessness services (SHS) based on where the person lived in the week before presenting to a SHS agency, as reported at the first support period during 2017–18. This location may not be a permanent address, for example, people who were couch surfing the week prior to seeking services may nominate the location of their temporary accommodation. Client location has been classified by statistical area 4 (there are 88 SA4s areas in total), based on the Australian Statistical Geography Standard (ASGS) [1] (see Technical information).
Key findings in 2017–18
- In 2017–18, the median rate of people accessing SHS services was 97.4 clients per 10,000 population.
- The Northern Territory-Outback area had the highest rate of SHS clients (563.7 clients per 10,000 population or 5,600 clients).
- The lowest rate of SHS clients came from the Sydney–Baulkham Hills and Hawkesbury area (17.0 clients per 10,000 population).
Geographic profile of SHS clients in 2017–18
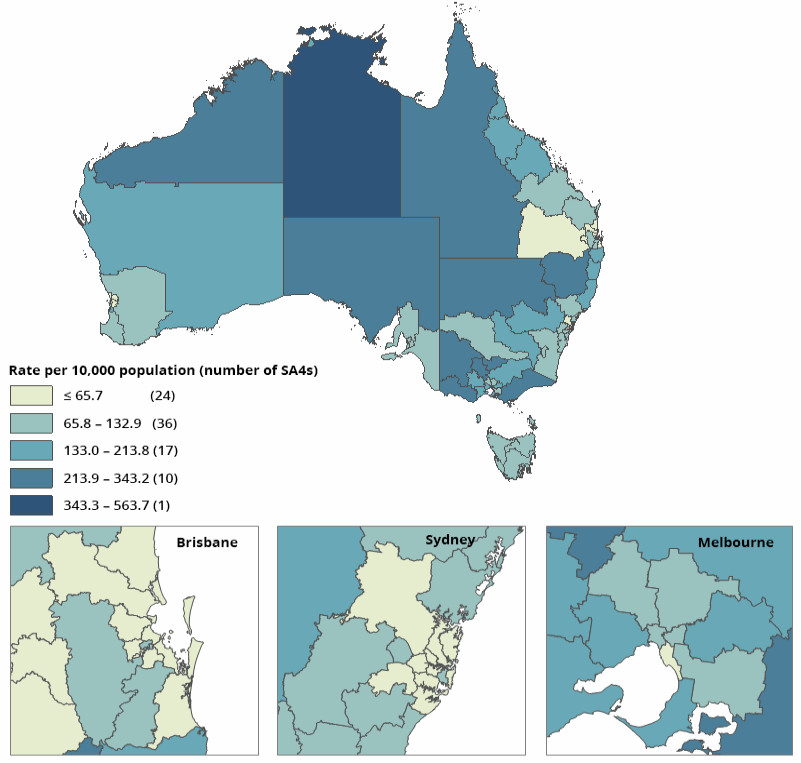
In 2017–18, SHS agencies assisted almost 288,800 clients across Australia with 109,200 clients presenting homeless and 131,300 presenting at risk of homelessness. Taking population into consideration, the rate of people seeking SHS services varied by region in 2017–18 (Figure CLIENTLOC.1):
- More than half of the SA4 areas (60 of 88 SA4s) had less than 132.9 clients per 10,000 population accessing SHS services.
- The Northern Territory–Outback had the highest rate of SHS clients (563.7 per 10,000 population); this was higher than the Northern Territory and national rates (377.3 and 117.4 respectively).
- Melbourne-West (Victoria) had the highest number of clients (15,100 clients or 191.1 per 10,000 population).
- Areas with the top 5 highest rates had, on average, 351.2 clients per 10,000 population (Table CLIENTLOC.1).
- SHS clients from regional areas within Victoria, such as Latrobe–Gippsland and Shepparton, had rates of more than 250.0 clients per 10,000 population (Figure CLIENTLOC.1).
- Lower rates of less than 50.0 clients per 10,000 population were observed in more highly populated urban areas within Brisbane (Queensland) and Sydney (New South Wales) (Figure CLIENTLOC.1, inserts (a) and (b)).
- Sydney-Baulkham Hills and Hawkesbury had the lowest client rate at 17.0 clients per 10,000 population (409 clients) (Table CLIENTLOC.1).
Figure CLIENTLOC.1: SHS clients seeking SHS services, rate per 10,000 population by SA4, 2017–18
Notes
- Client location based on location the week before first presenting to an SHS agency in 2017–18.
- Rates are crude rates based on the Australian estimated resident population at 30 June of the reference year.
- Mapped SA4s (88) exclude Other Territories and non-geographic SA4s coded as No usual address, Migratory, Offshore or Shipping.
Source: Specialist Homelessness Services Collection 2017–18, National supplementary table CLIENTLOC.1.
|
State |
SA4 |
Clients: |
Clients: number |
Homeless (per cent) |
At risk of homelessness (per cent) |
|---|---|---|---|---|---|
| Highest (rate per 10,000 ERP) | |||||
|
Northern Territory |
Northern Territory—Outback |
563.7 |
5,558 |
33.6 |
66.4 |
|
Western Australia |
Western Australia—Outback |
343.2 |
3,347 |
20.9 |
79.1 |
|
Victoria |
North West |
313.5 |
4,768 |
37.1 |
62.9 |
|
New South Wales |
Far West and Orana |
270.6 |
3,157 |
49.6 |
50.4 |
|
Victoria |
Latrobe—Gippsland |
264.9 |
7,400 |
38.6 |
61.4 |
|
Lowest (rate per 10,000 ERP) |
|
|
|
|
|
|
Queensland |
Sunshine Coast |
24.5 |
897 |
71.2 |
28.8 |
|
New South Wales |
Sydney—Ryde |
21.4 |
416 |
32.6 |
67.4 |
|
New South Wales |
Sydney—North Sydney and Hornsby |
19.9 |
856 |
35.3 |
64.7 |
|
Queensland |
Brisbane—West |
17.3 |
328 |
48.7 |
51.3 |
|
New South Wales |
Sydney—Baulkham Hills and Hawkesbury |
17.0 |
409 |
35.9 |
64.1 |
Notes
- Client location based on location the week before first presentation to an SHS agency in 2017–18.
- Rates are crude rates based on the Australian estimated resident population (ERP) at 30 June of the reference year.
- The SHSC classifies clients living with no shelter or improvised/inadequate dwelling, short-term temporary accommodation, or in a house, townhouse, or flat with relatives (rent-free) as homeless. Clients living in public or community housing (renter or rent-free), private or other housing (renter or rent-free), or in institutional settings are classified as at risk of homelessness.
- Proportions include clients with open support at the end of the reporting period. Per cent calculations are based on total clients, excluding ‘Not stated/other’.
- Due to improvements in the rates of agency participation and SLK validity, data are no longer weighted.
Source: Specialist Homelessness Services Collection 2017–18, National supplementary table CLIENTLOC.1.
References
- ABS (Australian Bureau of Statistics) 2016. Australian Statistical Geography Standard (ASGS): Volume 1—Main Structure and Greater Capital City Statistical Areas, July 2016. ABS cat. no. 1270.0.55.001. Canberra: ABS