Older clients
Older Australians are a national priority homelessness cohort in the National Housing and Homelessness Agreement, [1] recognising the severe impact homelessness may have on older Australians. During 2017–18, people aged 55 or older comprised 8% (24,100 clients) of all specialist homelessness services (SHS) clients. Specialist homelessness service use by this group is increasing with the number of clients up 33% since 2013–14 (around 18,200 clients).
For the purposes of the Specialist Homelessness Services Collection (SHSC), older people are defined at clients aged 55 years and over. For further information, see Technical notes.
Key findings in 2017–18
- There were about 24,100 people aged 55 years or older seeking homelessness services in 2017–18, an increase of 2% from 2016–17.
- 2 in 3 older clients presented housed but at risk of homelessness (67%).
- Housing outcomes improved; fewer older clients were homeless following support (down from 33% to 25%) with the largest decrease in the number of ‘rough sleepers’, down 4 percentage points to 7% at the end of support.
- Most older clients at risk of homelessness were assisted to maintain a housing tenancy (95%).
Profile of older clients in 2017–18
Of the almost 24,100 older clients who received SHS support during 2017–18:
- Older clients were less likely than the general SHS population to be female (57% compared with 61%).
- Almost 2 in 3 (65%) were aged 55–64; the remaining one-third were 65 or over.
- Older clients were more likely to be living alone (59%) than the general SHS population (30%).
- Older clients were less likely than the general SHS population to be homeless on presentation than the general SHS population (33% compared with 43%).
- Half (52%) of older clients sought assistance for the first time in 2017–18; the remaining 48% had received assistance at some time in the previous 5 years.
Vulnerabilities
Nearly half (49% or around 11,700) of older clients reported at least one vulnerability, that is, a mental health issue, domestic and family violence or problematic drug and/or alcohol use (Table OLDER.1).
- Almost 1 in 5 reported either domestic and family violence or mental health issues (19% and 18% respectively); a further 5% reported both of these issues.
- 2% reported problematic drug and/or alcohol use, while a further 3% reported both problematic drug and/or alcohol use and mental health issues.
- Very few older clients reported all three vulnerabilities (1%).
Table OLDER.1: Older clients (55 years and older), by selected vulnerability characteristics, 2017–18 (per cent)
|
Domestic and family violence |
Mental health issue |
Problematic drug and/or alcohol use |
Clients |
Per cent |
|---|---|---|---|---|
|
Yes |
No |
No |
4,600 |
19.1 |
|
Yes |
Yes |
No |
1,300 |
5.4 |
|
Yes |
No |
Yes |
100 |
0.4 |
|
No |
Yes |
Yes |
700 |
2.9 |
|
No |
Yes |
No |
4,300 |
17.9 |
|
No |
No |
Yes |
500 |
2.0 |
|
Yes |
Yes |
Yes |
200 |
0.8 |
|
No |
No |
No |
12,400 |
51.4 |
|
|
|
|
24,100 |
100 |
Notes
- Client vulnerability groups are mutually exclusive.
- Clients are aged 55 and over.
- Totals may not sum due to rounding.
Source: Specialist Homelessness Services Collection 2017–18.
Older clients: 2013–14 to 2017–18
Since 2013–14, the number of older clients seeking assistance from SHS agencies has increased at a greater rate than other age groups. Key trends identified in this client population over the 5 years to 2017–18 are (Table OLDER.2):
- The rate of older clients is increasing; the rate has increased from 8 older clients per 10,000 age-specific population in 2013–14 to 10 in 2017–18.
- The days of support received is increasing; the median number of days older clients receive support has increased from 21 days in 2013–14 to 28 days in 2017–18.
- The proportion receiving accommodation is decreasing; the proportion receiving any accommodation has fallen from 21% in 2013–14 to 16% in 2017–18. In addition, the median number of nights accommodated has decreased, down from 33 nights in 2013–14 to 29 nights in 2017–18.
Table OLDER.2: Older clients (55 years and older): at a glance—2013–14 to 2017–18
|
|
2013–14 |
2014–15 |
2015–16 |
2016–17 |
2017–18 |
|---|---|---|---|---|---|
|
Number of clients |
18,182 |
18,741 |
21,610 |
23,567 |
24,094 |
|
Proportion of all clients (per cent) |
7 |
7 |
8 |
8 |
8 |
|
Rate (per 10,000 population) |
7.9 |
8.0 |
9.1 |
9.7 |
9.8 |
|
Housing situation at the beginning of the first support period (proportion (per cent) of all clients) |
|||||
|
Homeless |
33 |
33 |
34 |
35 |
33 |
|
At risk of homelessness |
67 |
67 |
66 |
65 |
67 |
|
Length of support (median number of days) |
21 |
24 |
25 |
27 |
28 |
|
Average number of support periods per client |
1.5 |
1.5 |
1.5 |
1.5 |
1.6 |
|
Proportion receiving accommodation (per cent) |
21 |
19 |
18 |
17 |
16 |
|
Median number of nights accommodated |
33 |
31 |
31 |
30 |
29 |
|
Proportion of a client group with a case management plan |
45 |
48 |
50 |
51 |
52 |
|
Achievement of all case management goals (per cent) |
30 |
31 |
27 |
26 |
27 |
Notes
- Rates are crude rates based on the Australian estimated resident population (ERP) at 30 June of the reference year. Minor adjustments in rates may occur between publications reflecting revision of the estimated resident population by the Australian Bureau of Statistics.
- The denominator for the proportion achieving all case management goals is the number of client groups with a case management plan. Denominator values for proportions are provided in the relevant national supplementary table.
- Data for 2013–14 to 2016–17 have been adjusted for non-response. Due to improvements in the rates of agency participation and SLK validity, 2017–18 data are not weighted. The removal of weighting does not constitute a break in time series and weighted data from 2013–14 to 2016–17 are comparable with unweighted data for 2017–18. For further information, please refer to the Technical notes.
-
In 2017–18, age and age-related variables were derived using a more robust calculation method. Data for previous years have been updated with the improved calculation method for age. As such, data prior to 2017–18 contained in the SHS Annual Report may not match that contained in the SHS Annual Report Historical Tables.
Source: Specialist Homelessness Services Collection 2013–14 to 2017–18.
Housing situation
At the beginning of support, the majority of older clients were at risk of homelessness (67% or about 16,100 clients). One in 3 (33% or 8,000) older clients were homeless when first reporting to SHS agencies for assistance in 2017–18.
Reasons for seeking assistance
The three main reasons why clients within this group sought assistance from SHS agencies in 2017–18 were:
- housing crisis (21% or 5,000 clients)
- domestic and family violence (21% or 4,900)
- financial difficulties (17% or 4,000).
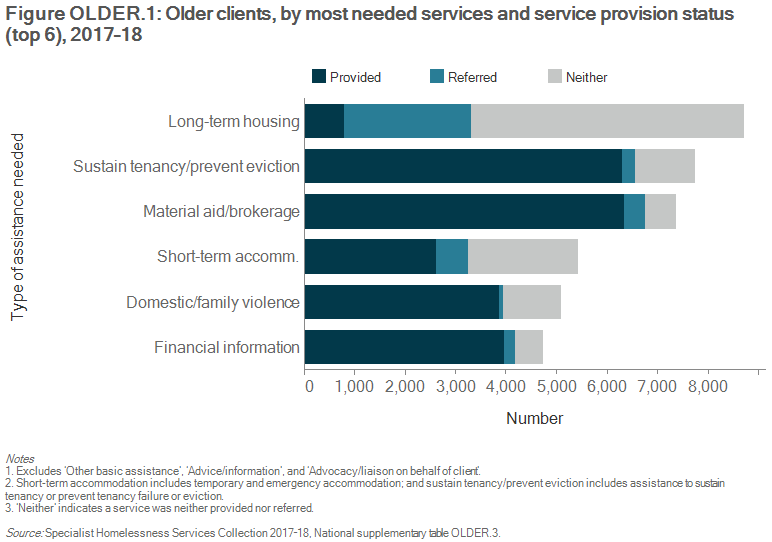
Services needed and provided
In 2017–18, older SHS clients were less likely to request accommodation services (46%) than the general SHS population (56%), potentially due to the lower proportion of older clients presenting homeless. However, of those who did request accommodation, most needed long-term housing (36%) and they were almost twice as likely as the general SHS population to be provided with this form of accommodation.
Other services most commonly needed by older clients during 2017–18 were:
- assistance to sustain tenancy or prevent tenancy failure or eviction (32%) with 81% provided this assistance
- material aid/brokerage (31%) with 86% provided this assistance
- short-term or emergency accommodation (23%) with 48% provided this assistance (Figure OLDER.1).
Housing outcomes
The outcomes presented in this section examine the changes in a client’s housing situation from the start of support to the end of support. Only clients who ceased receiving support by the end of the financial year are included in this section—meaning their support periods were closed and they did not have ongoing support at the end of the 2017–18 reporting period. However, it is important to note that a proportion of these clients may seek assistance from SHS agencies again in the future.
For older clients (Figure OLDER.2):
- The majority of older clients were at risk of homelessness upon presentation to an SHS agency (67%) with most living in private or other housing at the time (43%). This trend continued throughout support, with older clients most commonly ending their support in private or other housing (44% or about 6,800). The proportion of older clients in public or community housing following support also increased from 21% to 28% in 2017–18.
- There was a reduction in the proportion of older clients ‘rough sleeping’ (no shelter or improvised/inadequate dwelling), falling from 1 in 10 clients (11% or 1,700 clients) at the commencement of support to 7% (or around 1,000 clients) at the end of support.
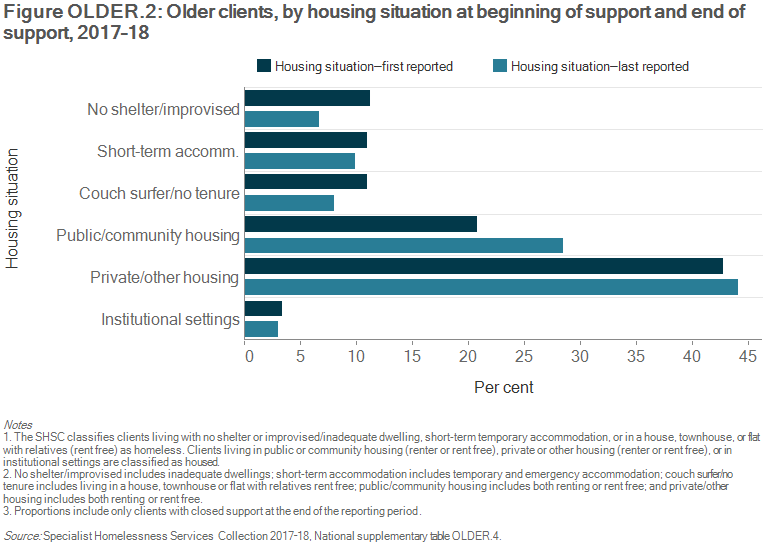
The majority of older clients were housed but at risk of homelessness when they began support (Table OLDER.3). For those older clients who had ended support:
- Agencies were best able to assist those in public or community housing or private or other housing; 95% were assisted to maintain some form of housing.
- Around 9 in 10 older clients were able to maintain their public or community housing tenancy (92% or 2,900 clients) with a further 4% assisted into private or other housing.
- Nearly 9 in 10 older clients were able to maintain their private or other housing tenancy (87% of 5,600 clients) with a further 7% assisted into public or community housing.
- For those older clients who were homeless when they began support, agencies were able to assist 35% into either public or community housing, private or other housing or institutional settings.
Table OLDER.3: Older clients, housing situation at beginning and end of support, 2017–18 (per cent)
| Situation at beginning of support | Situation at end of support: homeless |
Situation at end of support: housed |
|---|---|---|
|
Homeless |
65.1 |
34.9 |
|
At risk of homelessness |
5.1 |
94.9 |
Notes
- The SHSC classifies clients living with no shelter or improvised/ inadequate dwelling, short-term temporary accommodation, or in a house, townhouse, or flat with relatives (rent-free) as homeless. Clients living in public or community housing (renter or rent-free), private or other housing (renter or rent-free), or in institutional settings are classified as housed.
- Proportions include only clients with closed support at the end of the reporting period. Per cent calculations are based on total clients, excluding ‘Not stated/other’.
Source: Specialist Homelessness Services Collection 2017–18. National supplementary table OLDER.4.
Reference
- Council on Federal Financial Relations 2018. National Housing and Homelessness Agreement.