Clients with a current mental health issue
People with mental health issues are a group who are particularly vulnerable to homelessness. People living with a mental illness can be isolated, have disrupted family and social networks and sometimes suffer poor physical health, all of which impacts their capacity to find and maintain adequate housing. Several studies suggest that when people with mental health issues are supported by homelessness agencies, they are more likely to remain housed rather than returning to homelessness, in particular rough sleeping [1,2,3,4].
Specialist homelessness services (SHS) clients with a current mental health issue are identified as such if they provided any of the following information:
- They indicated that at the beginning of support they were receiving services or assistance for their mental health issues or had in the last 12 months.
- Their formal referral source to the SHS was a mental health service.
- They reported ‘mental health issues’ as a reason for seeking assistance.
- Their dwelling type either a week before presenting to an agency, or when presenting to an agency, was a psychiatric hospital or unit.
- They had been in a psychiatric hospital or unit in the last 12 months.
- At some stage during their support period, a need was identified for psychological services, psychiatric services or mental health services.
Key findings in 2017–18
- The number of clients experiencing a current mental health issue increased 4% from the previous year to just over 81,000 clients in 2017–18.
- Less than half of clients were living alone (45%) when they sought assistance.
- Almost 2 in 3 (64%) were returning clients, having received services in the 5 years to 2017–18.
- Around half were housed but at risk of homelessness when seeking support from a SHS agency (52%) and the remaining 48% presented as homeless.
- Following support, fewer clients were homeless (36%, down from 48%) with ‘rough sleepers’ dropping 6 percentage points to 8% (about 3,200 clients) at the end of support.
Profile of clients with a current mental health issue in 2017–18
Of the 81,000 clients reporting a current mental health issue in 2017–18:
- Around half (48%) were homeless when they presented to an agency for assistance. This is higher than the general SHS population (43%).
- They were more likely to present to a SHS agency alone (45%) or as a lone parent with child(ren) (23%) rather than as a couple with child(ren) (8%) or in a group (8%). In comparison, less than 1 in 3 (30%) of the general SHS population presented alone.
- Clients with a mental health issue were more likely than the general SHS population to come back to a SHS agency for support (2.4 support periods per client compared with 1.7). They also received a median of 72 days of support, almost twice as many days as the general SHS population (37 days of support).
- Most (64% or 51,900 clients) were ‘returning’ clients, that is, they had received homelessness services at some time in the previous 5 years up to 2017–18.
- Two in 3 clients (66%) with a current mental health issue received assistance from specialist homelessness services in Major cities.
- Nearly 1 in 5 clients (18% or 14,700 clients) experiencing a mental health issue were Indigenous. This is lower than the general SHS population (25%).
Vulnerabilities
Of the 81,000 SHS clients who were experiencing mental health issues, over half (54%) were also experiencing additional vulnerabilities (Table MH.1). For example:
- 3 in 10 clients (30% or 24,300 clients) reported both mental health issues and experiencing domestic and family violence.
- 14% (or 11,200 clients) were experiencing both mental health issues and drug or alcohol issues.
- A further 1 in 10 (10% or 7,900 clients) were experiencing all three vulnerabilities; domestic and family violence, drug or alcohol issues and mental health issues.
These figures provide an insight into the multiple disadvantages clients experiencing mental health issues face and suggest the need for an integrated service response to homelessness for these clients.
Table MH.1: Clients with a current mental health issue, by selected vulnerability characteristics, 2017–18 (per cent)
|
Mental health issue |
Domestic and family violence |
Problematic drug and/or alcohol use |
Clients |
Per cent |
|---|---|---|---|---|
|
Yes |
Yes |
No |
24,300 |
30.0 |
|
Yes |
No |
Yes |
11,200 |
13.8 |
|
Yes |
No |
No |
37,600 |
46.4 |
|
Yes |
Yes |
Yes |
7,900 |
9.7 |
|
|
|
|
81,000 |
100 |
Notes
- Client vulnerability groups are mutually exclusive.
- Clients are aged 10 and over.
- Totals may not sum due to rounding.
Source: Specialist Homelessness Services Collection 2017–18.
Clients with a current mental health issue: 2013–14 to 2017–18
The number of clients presenting with a current mental health issue has been increasing since the beginning of the Specialist Homelessness Services Collection (SHSC) in 2011–12. Various factors, including increased identification, community awareness and reduced stigma, have all potentially driven the increase in self-identification and reporting of mental illness among SHS clients. Key trends identified over the 5 years to 2017–18 include:
- Clients with a current mental health issue are one of the fastest growing client groups within the SHSC, growing at an average rate of 10% per year since 2013–14. Between 2016–17 and 2017–18 the increase was 4%, a smaller increase than in the previous periods.
- The rate of SHS service use by these clients has increased from 24 people per 10,000 population in 2013–14 to 33 people per 10,000 in 2017–18 (Table MH.2).
- The amount of support provided is increasing: an average of 2.4 support periods per client and a median of 72 days of support during 2017–18, compared with 2.3 periods and 67 days in 2013–14.
Table MH.2: Clients with a current mental health issue: at a glance—2013–14 to 2017–18
|
|
2013–14 |
2014–15 |
2015–16 |
2016–17 |
2017–18 |
|---|---|---|---|---|---|
|
Number of clients |
56,281 |
63,062 |
72,364 |
77,569 |
81,004 |
|
Proportion of all clients |
22 |
25 |
26 |
27 |
28 |
|
Rate (per 10,000 population) |
24.3 |
26.8 |
30.3 |
32.0 |
32.9 |
|
Housing situation at the beginning of the first support period (proportion (per cent) of all clients) |
|||||
|
Homeless |
50 |
50 |
50 |
50 |
48 |
|
At risk of homelessness |
50 |
50 |
50 |
50 |
52 |
|
Length of support (median number of days) |
67 |
62 |
64 |
68 |
72 |
|
Average number of support periods per client |
2.3 |
2.3 |
2.3 |
2.4 |
2.4 |
|
Proportion receiving accommodation |
44 |
42 |
39 |
37 |
37 |
|
Median number of nights accommodated |
48 |
44 |
44 |
45 |
43 |
|
Proportion of a client group with a case management plan |
69 |
70 |
70 |
71 |
72 |
|
Achievement of all case management goals (per cent) |
18 |
19 |
17 |
18 |
19 |
Notes
- Rates are crude rates based on the Australian estimated resident population (ERP) at 30 June of the reference year. Minor adjustments in rates may occur between publications reflecting revision of the estimated resident population by the Australian Bureau of Statistics.
- The denominator for the proportion achieving all case management goals is the number of client groups with a case management plan. Denominator values for proportions are provided in the relevant national supplementary table.
- Data for 2013–14 to 2016–17 have been adjusted for non-response. Due to improvements in the rates of agency participation and SLK validity, 2017–18 data are not weighted. The removal of weighting does not constitute a break in time series and weighted data from 2013–14 to 2016–17 are comparable with unweighted data for 2017–18. For further information, please refer to the Technical notes.
-
In 2017–18, age and age-related variables were derived using a more robust calculation method. Data for previous years have been updated with the improved calculation method for age. As such, data prior to 2017–18 contained in the SHS Annual Report may not match that contained in the SHS Annual Report Historical Tables.
Source: Specialist Homelessness Services Collection 2013–14 to 2017–18.
Housing situation
At the beginning of support, around half of the clients with a current mental health issue were at risk of homelessness (52% or about 42,100 clients) in 2017–18. A similar proportion (48% or almost 38,900) of clients experiencing a current mental health issue were homeless upon their first presentation to a SHS agency.
Reasons for seeking assistance
The main reasons clients presenting with a current mental health issue sought assistance were: housing crises (25%, or 19,800 clients), domestic and family violence (19%, or 15,200 clients), or inadequate or inappropriate dwelling conditions (11%, or 9,000 clients).
Services needed and provided
Compared with the general SHS population, clients with a current mental health issue were more likely to identify a need in 2017–18 for:
- accommodation services (70% compared with 56%), in particular long-term housing (52% compared with 36%)
- health/medical services (21% compared with 10%)
- drug and alcohol services (10% compared with 4%).
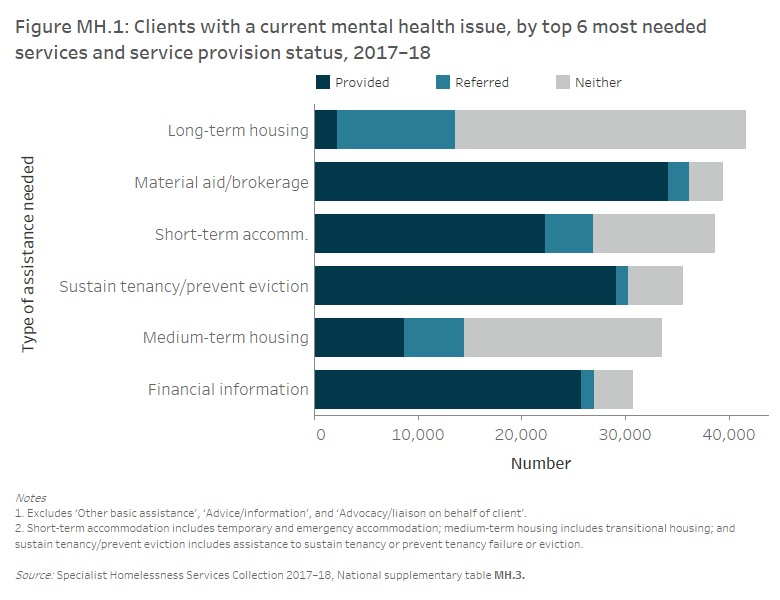
Of the accommodation services needed by clients with a current mental health issue (Figure MH.1):
- Around 38,700 clients (48%) needed short-term or emergency accommodation; 58% of these clients were provided this assistance.
- Over 33,500 clients (41%) needed medium-term/transitional housing; 26% of these clients were provided this assistance.
- About 41,700 clients (52%) needed long-term housing; 5% of these clients were provided this assistance.
Of those clients experiencing a current mental health issue, about 3 in 10 (29% or 23,700) identified a need for mental health-based services. Specifically:
- 25% (or 20,570 clients) identified a need for mental health services with 46% of these requests met.
- 11% (or 8,900 clients) identified a need for psychological services with 36% of these requests met
- 7% (or 5,300 clients) identified a need for psychiatric services with 39% of these requests met.
Clients experiencing a current mental health issue were also identified as needing:
- advocacy/liaison services (70% or 56,500 clients) with assistance provided to 97% of these clients
- assistance to sustain tenancy (44% or 35,600 clients) with assistance provided to 82% of these clients
- financial information (38% or 30,800 clients) with assistance provided to 84% of these clients.
These services were needed by clients with a mental health issue at higher rates than the general SHS population (advocacy/liaison services 54%, assistance to sustain tenancy 33% and financial information 25%).
Housing outcomes
The outcomes presented in this section examine the changes in clients’ housing situations from the start of support to the end of support. Only clients who ceased receiving support by the end of the financial year are included in this section—meaning their support periods had closed and they did not have ongoing support at the end of the 2017–18 reporting period. However, it is important to note that a proportion of these clients may seek assistance from SHS agencies again in the future.
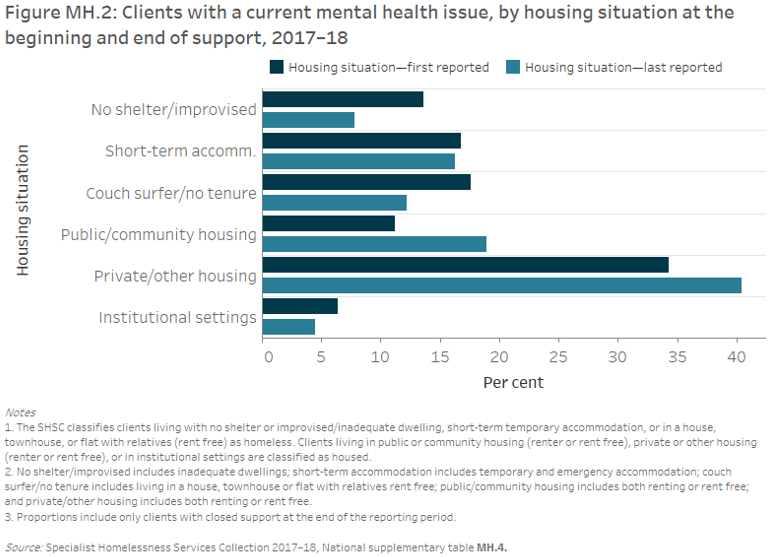
For clients with a current mental health issue (Figure MH.2):
- 64% (or 31,500 clients) ended support housed, an increase from 52% (or 26,800) at the start of support.
- Under 20,000 clients (40%) were in private rental at the end of support, increasing from 34% at the commencement of support.
- Around 9,300 clients (19%) were in public or community housing, which is an increase of 3,500 clients from the commencement of support.
- Less than 1 in 10 (8%) were homeless and rough sleeping (see Glossary[CJ1] ) at the end of support which is almost half the rate at the beginning of support (14%).
Of those clients who were housed but at risk of homelessness at the beginning of support (that is, living in either public or community housing (renter or rent-free), private or other housing (renter or rent-free), or in institutional settings) (Table MH.2):
- The majority (86% or 21,300 clients) were also housed at the end of support.
- 8 in 10 (79% or 13,100 clients) clients in private or other housing were assisted to maintain this tenancy, and a further 7% were assisted into public or community housing at the end of support.
- Most of those (80% or 4,400 clients) in public or community housing were assisted to maintain this tenancy, with an additional 9% (almost 500 clients) assisted into private or other housing.
Of those clients who were homeless (that is, living either with no shelter or improvised/inadequate dwelling, short-term temporary accommodation, or in a house, townhouse, or flat with relatives (rent-free)) when they began SHS support (Table MH.3):
- 2 in 5 (40% or 8,800 clients) were assisted into housing at the end of support while 60% (or 13,300 clients) remained homeless.
- Agencies were able to assist 45% of those in short-term or emergency accommodation (or 3,500 clients) into housing, as well as 41% of couch surfers (nearly 3,400 clients). In both instances, the majority of clients were housed in private or other housing at the end of support.
A challenge for SHS agencies is finding suitable housing options for clients. SHS agencies were able to assist many clients with a current mental health issue to either find or maintain housing, however, consistent with other studies, exiting homelessness for these clients can be difficult [5].
Table MH.3: Clients with mental health issues, housing situation at beginning and end of support, 2017–18 (per cent)
| Situation at beginning of support | Situation at end of support: homeless | Situation at end of support: housed |
|---|---|---|
|
Homeless |
60.2 |
39.8 |
|
At risk of homelessness |
14.4 |
85.6 |
Notes
- The SHSC classifies clients living with no shelter or improvised/inadequate dwelling, short-term temporary accommodation, or in a house, townhouse, or flat with relatives (rent-free) as homeless. Clients living in public or community housing (renter or rent-free), private or other housing (renter or rent-free), or in institutional settings are classified as housed.
- Proportions include only clients with closed support at the end of the reporting period. Per cent calculations are based on total clients, excluding ‘Not stated/other’.
Source: Specialist Homelessness Services Collection 2017–18, National supplementary table MH.4.
References
- Mental Health Council of Australia (MHCA) 2009. Home Truths: Mental Health, Housing and Homelessness in Australia.
- Du C, Jacobs K, Loo S & Murray S 2013. The role of informal community resources in supporting stable housing for young people recovering from mental illness: key issues for housing policy-makers and practitioners. AHURI Final Report No. 199. Australian Housing and Urban Research Institute Limited.
- Wood L, Flatau P, Zaretzky K, Foster, S, Vallesi, S & Miscenko, D 2016. What are the health, social and economic benefits of providing public housing and support to formerly homeless people? AHURI Final Report No. 265. Melbourne: Australian Housing and Urban Research Institute Limited.
- Australian Bureau of Statistics (ABS) 2014. Mental Health and Experiences of Homelessness, Australia, 2014. ABS cat. no. 4329.0.00.005. Canberra: ABS.
- Chamberlain C & Johnson G 2013. Pathways into adult homelessness. Journal of Sociology, 49(1): 60–77.