Clients who have experienced domestic and family violence
Domestic and family violence is the main reason women and children leave their homes in Australia [1] and is consistently one of the most common reasons clients seek assistance from specialist homelessness services (SHS) (see Clients, services and outcomes). Women and children affected by family and domestic violence are a national priority cohort listed in the National Housing and Homelessness Agreement [2], which came into effect on 1 July 2018.
While SHS agencies mainly assist people who are victims of domestic and family violence, they may also assist perpetrators of violence who seek homelessness services. Currently, the Specialist Homelessness Services Collection (SHSC) cannot separately identify these groups.
Key findings in 2017–18
- Overall, 42% of clients (or 121,100) reported experiencing domestic and family violence at some point during the reporting period, an increase from 40% in 2016–17.
- Nearly half (47%) were single parents with a child or children.
- Many were children: One-fifth of clients were aged 0–9 (22% or over 26,500), and nearly 41,700 (34%) clients were aged under 18 (a 4% increase from 2016–17 for those aged under 18).
- Almost all adults were female: Adults aged 25–34 were the largest proportion of adult service users (20% or 24,500 clients); most of these clients (94%) were female.
- On average, each client received assistance twice from homelessness agencies over the 12 month period (2.0 support periods per client) for a total of 43 days.
- The largest improvement in housing situation was among clients in public or community housing—up from 16% at the start of support to 23% at the end of support.
Profile of clients experiencing domestic and family violence in 2017–18
In 2017–18, SHS agencies assisted around 121,100 clients who had experienced domestic and family violence. In 2017–18, compared with 2016–17:
- There were about 6,300 (5%) more clients seeking assistance for domestic and family violence, which is consistent with the growth rate of the general SHS population (5%).
- The growth in client numbers was largely due to increases in Victoria (over 6,600 clients) and New South Wales (around 900 clients).
- More than 3 in 4 (78%) were female, similar to the previous year (77%).
- Almost half were single parents, with 47% of all clients seeking assistance for domestic and family violence living in single parent households, similar to 2016–17.
- Most were housed when seeking support, with 61% at risk of homelessness when first presenting for support, consistent with the previous year (61%).
- There was a similar distribution of ‘new’ and ‘returning’ clients compared with the previous year (48% and 52%, respectively). While this trend was observed in New South Wales, Victoria and Queensland, there was a higher proportion of returning clients in South Australia, Tasmania, the Australian Capital Territory and the Northern Territory than in the previous year.
- 1 in 4 clients (22%) were Indigenous, similar to the overall SHS population in 2017–18, and the proportion of Indigenous clients in 2016–17.
Vulnerabilities
In 2017–18, 94,700 clients aged 10 years and over experienced domestic and family violence. Of these, 37% (or 34,800 clients) also reported experiencing at least one additional vulnerability (either a mental health issue or problematic drug and/or alcohol use). Almost two-thirds (63% or 59,900) of clients experiencing domestic and family violence did not report experiencing an additional vulnerability (Table DV.1).
TABLE DV.1: Clients who have experienced domestic and family violence (aged over 10), by selected vulnerability characteristics, 2017–18
|
Domestic and family violence |
Mental health issue |
Problematic drug and/or alcohol use |
Clients |
Per cent |
|---|---|---|---|---|
|
Yes |
No |
No |
59,900 |
63.2 |
|
Yes |
Yes |
No |
24,300 |
25.7 |
|
Yes |
No |
Yes |
2,600 |
2.8 |
|
Yes |
Yes |
Yes |
7,900 |
8.3 |
|
|
|
|
94,660 |
100 |
Notes
- Client vulnerability groups are mutually exclusive.
- Clients are aged 10 and over.
- Totals may not sum due to rounding.
Source: Specialist Homelessness Services Collection 2017–18.
Clients experiencing domestic and family violence: 2013–14 to 2017–18
The number of clients reporting they had experienced domestic and family violence has increased since 2013–14. Key trends identified over the past 5 years include:
- Nationally, the number of clients reporting they had experienced domestic and family violence and sought assistance from specialist homelessness agencies has risen, on average 9% each year since 2013–14. This represents an increase in the rate from 36.6 per 10,000 population in 2013–14 to 49.2 per 10,000 population in 2017–18 (Table DV.2). Most of these additional clients were single parent households (with a child or children).
- Tasmanian SHS agencies experienced the greatest average annual growth of domestic and family violence clients (13% each year), followed by the Northern Territory (11% each year); however, Victoria has the most number of clients.
- The proportion of clients who were homeless upon presentation has increased, from 37% in 2013–14 to 39% in 2017–18.
- The proportion of clients ending support with improved housing outcomes increased over the period, particularly for those in private housing (from 46% in 2013–14 to 48% in 2017–18).
Table DV.2: Clients who have experienced domestic and family violence: at a glance—2013–14 to 2017–18
|
|
2013–14 |
2014–15 |
2015–16 |
2016–17 |
2017–18 |
|---|---|---|---|---|---|
|
Number of clients |
84,774 |
92,349 |
105,619 |
114,757 |
121,116 |
|
Proportion of all clients |
33 |
36 |
38 |
40 |
42 |
|
Rate (per 10,000 population) |
36.6 |
39.3 |
44.3 |
47.4 |
49.2 |
|
Housing situation at the beginning of first support period (proportion (per cent) of all clients) |
|||||
|
Homeless |
37 |
37 |
38 |
39 |
39 |
|
At risk of homelessness |
63 |
63 |
62 |
61 |
61 |
|
Length of support (median number of days) |
43 |
40 |
38 |
39 |
43 |
|
Average number of support periods per client |
1.8 |
1.8 |
1.9 |
1.9 |
2.0 |
|
Proportion receiving accommodation |
44 |
41 |
39 |
37 |
35 |
|
Median number of nights accommodated |
34 |
32 |
31 |
31 |
31 |
|
Proportion of a client group with a case management plan |
63 |
64 |
64 |
64 |
65 |
|
Achievement of all case management goals (per cent) |
17 |
22 |
21 |
20 |
20 |
Notes
- Rates are crude rates based on the Australian estimated resident population (ERP) at 30 June of the reference year. Minor adjustments in rates may occur between publications reflecting revision of the estimated resident population by the Australian Bureau of Statistics.
- The denominator for the proportion achieving all case management goals is the number of client groups with a case management plan. Denominator values for proportions are provided in the relevant national supplementary table.
- Data for 2013–14 to 2016–17 have been adjusted for non-response. Due to improvements in the rates of agency participation and SLK validity, 2017–18 data are not weighted. The removal of weighting does not constitute a break in time series and weighted data from 2013–14 to 2016–17 are comparable with unweighted data for 2017–18. For further information, please refer to the Technical notes.
Source: Specialist Homelessness Services Collection 2013–14 to 2017–18.
Housing situation
At the beginning of support, the majority of clients experiencing domestic and family violence were at risk of homelessness (61% or about 73,900 clients). Two in 5 (39% or about 47,200) clients were homeless when first reporting to a SHS agency for assistance in 2017–18 (Supplementary Table DV.4).
Reasons for seeking assistance
There were 2 main reasons why clients within this group sought assistance from SHS agencies. Domestic and family violence was identified as the main reason for 7 in 10 clients (71%), while housing crisis was identified as the main reason by 10% of clients.
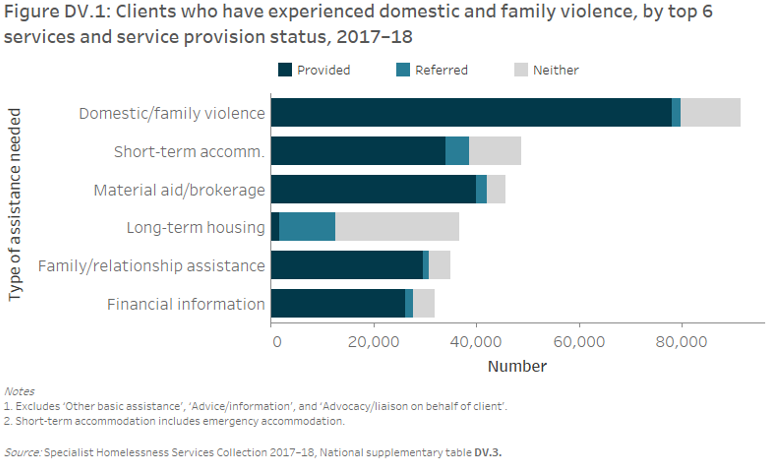
Services needed and provided
More than 3 in 4 (76% or 91,500) SHS clients who had experienced domestic and family violence needed specific assistance for this reason, including therapeutic discussion or group sessions, counselling and specialised support services. Of those identified as needing assistance for domestic and family violence, 85% were provided assistance.
The next most common services requested by this client group were (Figure DV.1):
- advice/information (75% or over 90,900), with 99% receiving this service
- advocacy/liaison (55% or over 66,800), with 97% receiving this service
- short-term or emergency accommodation (40% or over 48,800), with 70% receiving this service
- material aid/brokerage (38% or over 45,700), with 88% receiving this service
- long-term housing (30% or over 36,600) with 4% receiving this service.
Housing outcomes
The outcomes presented in this section examine the changes in clients’ housing situations from the start of support to the end of support. Only clients who ceased receiving support by the end of the financial year are included in this section—meaning their support periods had closed and they did not have ongoing support at the end of the 2017–18 reporting period. It is important to note that a proportion of these clients may seek assistance from SHS agencies again in the future.
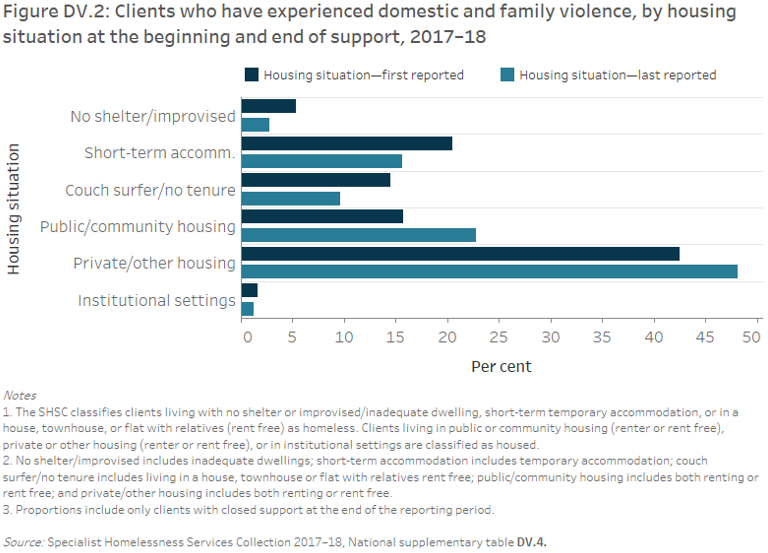
For clients experiencing domestic and family violence whose support ended in 2017–18 (Figure DV.2):
- the proportion of clients experiencing homelessness decreased from 40% to 28% (this decrease was largest for those living in short-term or emergency accommodation (from 21% to 16%)).
- almost half (48%) were living in private or other housing (renter or rent free) following support—up from 43% at the start of support.
- almost 1 in 4 (23%) were living in public or community housing following support—up from 16% at the start of support.
Of those clients who were housed, but at risk of homelessness at the beginning of support (that is, living in either public or community housing (renter or rent free), private or other housing (renter or rent free), or in an institutional setting (Table DV.3):
- 9 in 10 (89% or about 30,600 clients) were successfully assisted to maintain their tenancy
- 81% (7,400) remained in public or community housing and a further 8% were housed in private or other housing
- 83% (20,300) remained in private or other housing and a further 6% were housing in public or community housing.
Of those clients experiencing domestic and family violence who were homeless when they began support:
- 46% (10,500 clients) were assisted into stable housing at the end of support, the majority into private or other housing.
- 57% (6,000) were assisted into private or other housing.
- 40% (4,200) were assisted into public or community housing.
Agencies were best able to assist those in short-term or emergency accommodation (50% or over 5,900 clients) and couch surfers (44% or about 3,600 clients) into housing.
TABLE DV.3: Clients who have experienced domestic and family violence, housing situation at beginning and end of support, 2017–18 (per cent)
| Situation at beginning of support | Situation at end of support: homeless | Situation at end of support: housed |
|---|---|---|
|
Homeless |
53.6 |
46.4 |
|
At risk of homelessness |
11.0 |
89.0 |
Notes
- The SHSC classifies clients living with no shelter or improvised/ inadequate dwelling, short-term temporary accommodation, or in a house, townhouse, or flat with relatives (rent free) as homeless. Clients living in public or community housing (renter or rent free), private or other housing (renter or rent free), or in institutional settings are classified as housed.
- Proportions include only clients with closed support at the end of the reporting period. Per cent calculations are based on total clients, excluding ‘Not stated/other’.
Source: Specialist Homelessness Services Collection 2017–18, National supplementary table DV.4.
References
- Spinney A, 2012. Home and safe? Policy and practice innovations to prevent women and children who have experienced domestic and family violence from becoming homeless. Final report no. 196. Melbourne: Australian Housing and Urban Research Institute.
- Council on Federal Financial Relations 2018. National Housing and Homelessness Agreement.