
In what circumstances did people drown?
Drowning in natural bodies of water
A total of 106 (44%) drowning deaths were the result of drowning in a natural body of water, such as a lake, river, or the open sea. Of these deaths, 89 (84%) involved males.
Of those deaths 76 (72%) occurred when the person was already in the water, while 30 (28%) occurred after the person fell into a body of natural water.
Drowning in bathtub
A total of 20 (8%) drowning deaths occurred in a bathtub. In nearly all instances, the person drowned while already in a bathtub, rather than from a fall into a bathtub.
Transport-related drowning
A total of 40 (16%) unintentional drowning deaths were related to transport, so are included in Transport crashes section. Of these deaths, 33 (83%) were males.
In 17 (43%) of these deaths, drowning was caused by an accident to a watercraft (for example, an overturning or sinking boat, falling or jumping from a burning ship, and so forth).
In another 16 (40%) of deaths, the drowning was related to water transport, but did not result from an accident to watercraft (for example, fall from ship, fall overboard, and so forth).
Drowning in swimming pools
A total of 38 (16%) unintentional drowning deaths occurred in a swimming pool. Of these, 11 (29%) involved children aged under 5, while just over half (53%) were males.
In 18 (47%) of these deaths, the person was already in the swimming pool, while 20 (53%) drowned after falling into the pool.
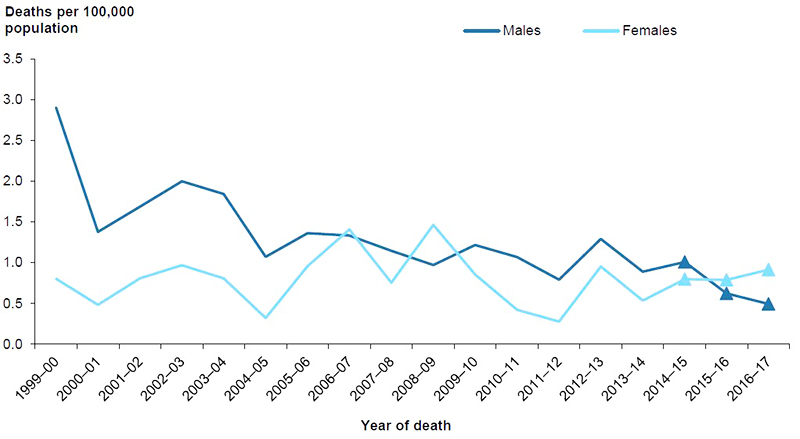
Drowning in swimming pools has been a major cause of death for young children in Australia for several decades, and the subject of specific preventative efforts. Age-standardised rates of swimming-pool drowning for boys and girls aged 0–4 fluctuated over the period, due to small case numbers, and have remained under 1.5 deaths per 100,000 population for both sexes since 2004–05 (Figure 4.1).
In 2016–17, the rate of death by drowning in a swimming pool for children aged 0–4 was 0.7 deaths per 100,000 population.
Figure 4.1: Age-specific rates of unintentional drowning deaths in swimming pools, children aged 0–4, by sex, 1999–00 to 2016–17
Notes:
- Values for the latest 3 years, shown as triangles, are subject to change due to later revisions of cause-of-death data by the ABS (see Appendix A for more information).
- Data underpinning this figure are available in the supplementary table spreadsheet Table SF4.1.
Source: AIHW NMD.
How have unintentional drowning deaths changed over time?
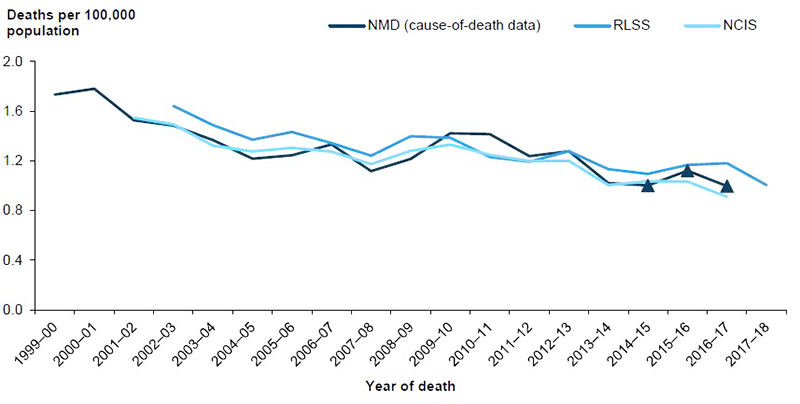
Crude rates of drowning deaths decreased from 1.7 deaths per 100,000 population in 1999–00 to 1.1 in 2007–08, an average decline of 5.3% per year (Figure 4.2).
Rates rose between 2007–08 and 2009–10, before dropping back to 1.0 by 2016–17. Over the entire period from 1999–00 to 2016–17, there was an average decline in rates of 2.6% per year. But rates for 2014–15 to 2016–17 are subject to review and revision.
Estimates based on NMD data are supplemented in this section by rates based on 2 other sources of data.
Data based on annual drowning reports published by the Royal Life Saving Society (RLSS), and available at the RLSS Website, show an average fall of 4.7% per year between 2002–03 and 2007–08, and a fall of 2.4% per year between 2002–03 and 2016–17.
Estimates based on NCIS data, as at March 2019, show an average annual fall of 4.1% per year between 2001–02 (the first full year for which national NCIS data were available) and 2007–08, and a fall of 2.6% per year between 2001–02 and 2016–17.
Differences in case definitions and methods between sources, particularly between the NMD and the RLSS, are such that identical rates are not be expected.
Further information on the method used to produce the supplementary estimates is provided in Appendix A.
Crude rates were calculated for NMD data to allow better comparability with the RLSS and NCIS-based estimates, and because there was little difference between crude and adjusted rates for the NMD data.
Figure 4.2: Crude rates of unintentional drowning deaths, 1999–00 to 2016–17
Notes:
- Values for the latest 3 years of NMD-based rates, shown as triangles, are subject to change due to later revisions of cause-of-death data by the ABS (see Appendix A for more information).
- Data underpinning this figure are available in the supplementary table spreadsheet Table SF4.2.
Sources: AIHW NMD; RLSS; NCIS.
Age and sex
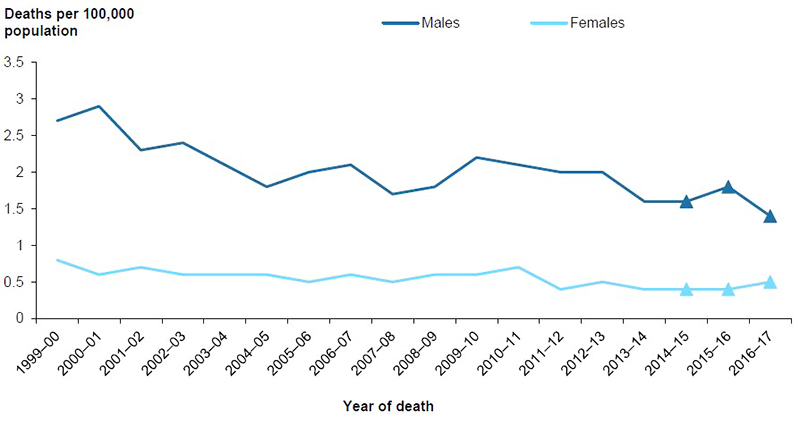
Between 1999–00 and 2016–17, age-standardised rates of drowning deaths for males declined by an average of 2.5% per year, while rates for females declined by an average of 2.6% per year (Figure 4.3). Rates were consistently 3–5 times as high for males as for females.
Figure 4.3: Age-standardised rates of unintentional drowning deaths, by sex, 1999–00 to 2016–17
Notes:
- Values for the latest 3 years, shown as triangles, are subject to change due to later revisions of cause-of-death data by the ABS (see Appendix A for more information).
- Data underpinning this figure are available in the supplementary table spreadsheet Table SF4.3.
Source: AIHW NMD.
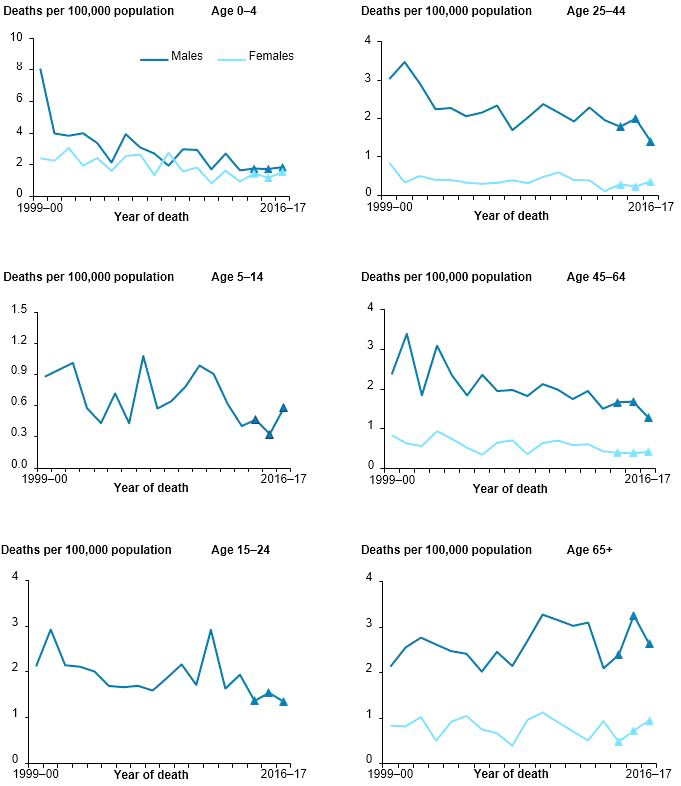
Figure 4.4 shows changes in drowning death rates between 1999–00 and 2016–17, in each age group by sex.
Rates for males were higher than for female across all age groups for all years, except in 2008–09 for young children aged 0–4, where case numbers are low. The differences in rates between males and females was most marked for those aged 25–44, where male rates were consistently more than 4 times as high as female rates.
Apart from men aged 65 and over, there was a general downward trend in rates for all age groups for males over the period. Rates for boys aged 5–14 fluctuated markedly over time, due to relatively small numbers. Rates for females fell over the period for those aged 0–4, 25–44, and 45–64. Rates for females aged 5–14 and 15–24 were not shown due to low case numbers.
Figure 4.4: Age-specific rates of unintentional drowning deaths, by age and sex, 1999–00 to 2016–17
Notes:
- Values for the latest 3 years, shown as triangles, are subject to change due to later revisions of cause-of-death data by the ABS (see Appendix A for more information).
- Data underpinning this figure are available in the supplementary table spreadsheet Table SF4.4.
- Rates for females aged 5–14 and 15–24 are not shown, due to small numbers.
Source: AIHW NMD.
Remoteness of usual residence
Rates for Remote and Very remote areas are combined in this section, due to small numbers of deaths.
Rates of drowning deaths for residents Remote and very remote areas were consistently higher than rates for residents of less remote areas, and consistently 2–4 times as high as for residents of Major cities (Figure 4.5). The fluctuation in rate of drowning deaths in Remote and very remote areas is partly a reflection of the small population and number of deaths each year. The rise in the rate for Remote and very remote areas between 2015–16 and 2016–17 is partly due to a mass fatality incident involving widespread flooding.
In 2009–10—the only year for which both ASGC-based and ASGS-based rates are shown— ASGC-based rates for residents of Outer regional areas were higher than the ASGS-based rates, while for Remote and very remote areas, the ASGS-based rates were higher.
See Appendix A for more information of the ASGC and ASGS classification systems.
Figure 4.5: Age-standardised rates of unintentional drowning deaths, by remoteness of usual residence, 2001–02 to 2016–17
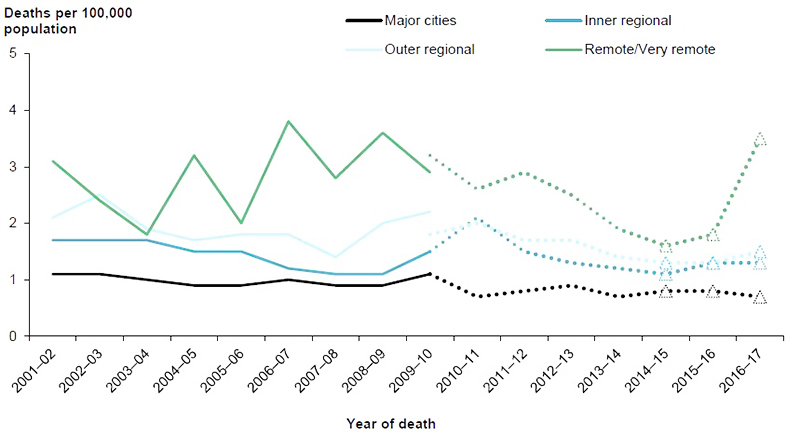
Notes:
- Data for 1999−00 and 2000–01 were unavailable.
- The rates for Remote and very remote areas are combined, due to small numbers.
- Full lines are ASGC-based, while dotted lines are ASGS-based.
- Values for the latest 3 years, shown as triangles, are subject to change due to later revisions of cause-of-death data by the ABS (see Appendix A for more information).
- Data underpinning this figure are available in the supplementary table spreadsheet Table SF4.5.
Source: AIHW NMD.
Aboriginal and Torres Strait Islander people
Age-standardised rates of drowning for Aboriginal and Torres Strait Islander people fluctuated markedly from year to year between 1999–00 and 2016–17, at least partly because even small changes in the annual number of deaths (10–20 per year) have a substantial effect on the rates (Figure 4.6).
Rates declined slightly over the period, but this was not statistically significant. In comparison, rates for non-Indigenous Australians declined by an average of 2.0% per year over the period of interest.
Rates for Aboriginal and Torres Strait Islander people were generally 1.5–2.5 times as high as rates for non-Indigenous Australians over the period.
Figure 4.6: Age-standardised rates of unintentional drowning deaths, by Indigenous status, 2001–02 to 2016–17
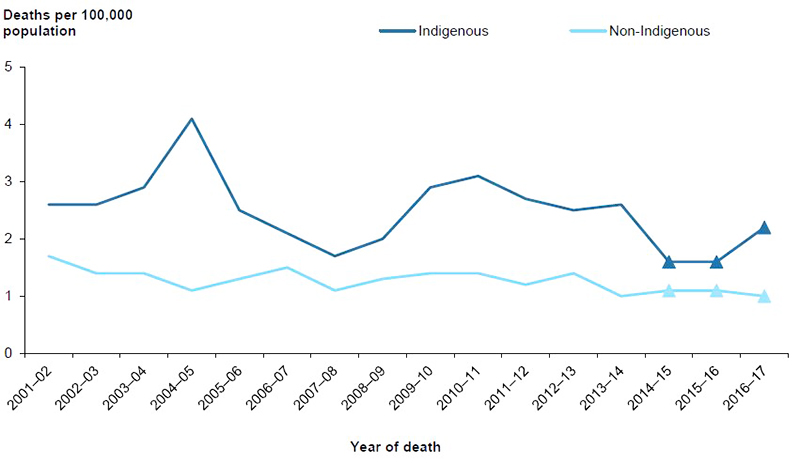
Notes:
- Data are for New South Wales, Queensland, Western Australia, South Australia, and the Northern Territory, the 5 jurisdictions for which recording of Indigenous status was considered to be of adequate quality throughout the study period.
- Values for the latest 3 years, shown as triangles, are subject to change due to later revisions of cause-of-death data by the ABS (see Appendix A for more information).
- Data underpinning this figure are available in the supplementary table spreadsheet Table SF4.6.
Source: AIHW NMD.