
Other unintentional injury
This section provides a brief overview of deaths in 2016–17 that involved types of unintentional injury not covered in in this report.
Trends are not presented in this section, because it includes deaths due to a diverse variety of causes.
Trends of some types of death included in this section were also affected markedly by changes in methods of processing mortality data that occurred during the period, which is shown by presenting trends for certain causes. Further information for 1999–2010 has previously been reported (AIHW: Harrison & Henley 2015).
What methods were used?
The criteria given in Section 1.3 were applied, and the records that included the following ICD-10 codes were included in this section:
- the UCoD was a code from Unintentional external causes of injury not included in other sections
- the MCoDs included codes from Unintentional external causes of injury not included in other sections, and at least 1 code for Injury (S00–T75 or T79).
Box 9.1: External causes of other unintentional injury
Other unintentional injury of Chapter XX External causes of morbidity and mortality of ICD-10 includes:
- Exposure to inanimate and animate mechanical forces (W20–W64)
- Accidental threats to breathing (W75–W84)
- Exposure to electric current, radiation and extreme ambient air temperature and pressure (W85–W99)
- Contact with venomous animals and plants (X20–X29)
- Exposure to forces of nature (X30–X39)
- Overexertion, travel and privation (X50–X57)
- Accidental exposure to other and unspecified factors (X58–X59).
All deaths with UCoD of X59 (Accidental exposure to unspecified factors) in conjunction with fracture codes are included in section ‘Falls’, and not in this section.
Suicide and homicide deaths (UCoD X60–Y09) were excluded. The concepts underlying the abbreviations used in this section are defined in the Glossary.
How many deaths in 2016–17 were due to other unintentional injury?
Other unintentional injury accounted for 1,698 injury deaths, about 13% of all injury deaths for this period (Table 9.1). During this time, 1.5 times as many males as females were fatally injured due to other unintentional causes.
Table 9.1: Key indicators for other unintentional injury deaths, by sex, 2016–17
|
Indicator |
Males | Females | Persons |
|---|---|---|---|
|
Number |
1,017 |
681 |
1,698 |
| Percentage of all injury deaths | 12.8 | 13.1 | 12.9 |
| Crude rate (deaths per 100,000 population) | 8.4 | 5.5 | 7.0 |
| Age-standardised rate (deaths per 100,000 population) | 7.9 | 4.1 | 5.9 |
Source: AIHW NMD.
Overview of other unintentional injury deaths
Table 9.2 shows the mechanisms that were responsible for deaths included in this section, with numbers and proportions of deaths in 2016–17.
The most common mechanism was Inhalation and ingestion of gastric contents, food or other objects causing obstruction of the respiratory tract (1,048 deaths, or 62% of all deaths from other unintentional injury deaths). Deaths were heavily concentrated in older age groups, with 858 (82%) of deaths involving this mechanism being among people aged 65 and over.
Table 9.2: Major mechanisms of deaths included in the other unintentional injury category, 2016–17
|
ICD-10 codes |
Mechanism | Number(a) | % |
|---|---|---|---|
|
W20–W22 |
Struck against or struck by object |
38 | 2.2 |
|
W23 |
Caught, crushed, jammed or pinched in or between objects | 22 | 1.3 |
|
W24 |
Contact with lifting and transmission devices, n.e.c. | 2 | 0.1 |
|
W25–W26 |
Contact with sharp object (includes sharp glass, knife, sword or dagger) | 7 | 0.4 |
|
W27–W31 |
Contact with tools or machinery (includes non-powered or powered hand tools, agricultural machinery, powered lawnmower | 10 | 0.6 |
| W32–W34 | Unintentional discharge of firearms | 3 | 0.2 |
| W35–W40 | Unintentional explosions (includes explosion and rupture of boiler, gas cylinder, pressurised tyre, pipe, hose, firework, and other materials) | 3 | 0.2 |
|
W41–W43 |
Exposure to high-pressure jet, noise or vibration | 0 | 0.0 |
| W44–W45 | Foreign body entering into or through eye or natural orifice, or through skin | 1 | 0.1 |
|
W46 |
Contact with hypodermic needle | 4 | 0.2 |
| W49 | Exposure to other and unspecified inanimate mechanical forces | 3 | 0.2 |
|
W50–W52 |
Struck by or against another person, or crushed, pushed or steeped on by crowd of people | 4 | 0.2 |
| W53–W59 | Bitten, struck, stung, crushed or contact with mammals, marine animals, insects or reptiles | 13 | 0.8 |
|
W64 |
Exposure to other and unspecified animate mechanical forces | 0 | 0.0 |
| W75–W77 | Unintentional hanging, suffocation and strangling | 30 | 1.8 |
| W78–W80 |
Inhalation and ingestion of gastric contents, food or other objects causing obstruction of the respiratory tract |
1,048 | 61.7 |
| W81–W84 | Other threats to breathing (includes trapped in a low oxygen environment, asphyxiation, aspiration and suffocation, n.e.c.) | 18 | 1.1 |
|
W85–W87 |
Electrocution | 12 | 0.7 |
| W91 | Exposure to unspecified type of radiation | 1 | 0.1 |
|
W92–W99 |
Exposure to environmental factors (includes heat or cold of man-made origin and exposure to high and low air pressure) | 3 | 0.2 |
| X20–X29 | Contact with venomous animals and plants | 6 | 0.4 |
|
X30–X39 |
Exposure to forces of nature (includes natural heat or cold, lightning, earthquake, flood, avalanche or landslide) | 48 | 2.8 |
| X50–X57 | Overexertion, travel and privation | 11 | 0.6 |
| X58–X59(b) | Exposure to other or unspecified factors | 423 | 24.9 |
| Total | 1,698 | 100.0(b) | |
Notes:
- Excludes X59 accompanied by MCoD for fracture (these deaths are included in Falls).
- The total number of the individual mechanisms exceeds the total number of deaths, because some deaths have been assigned more than 1 external cause code, resulting in death being counted in more than 1 category, and the mechanism-specific proportions sum to more than 100%.
Source: AIHW NMD.
Trends for selected mechanisms of injury
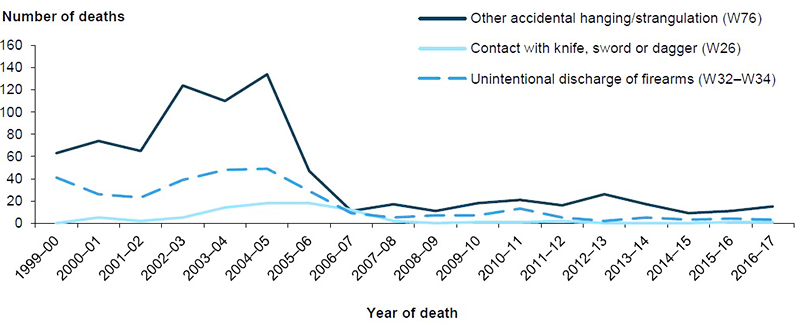
Classification of some of the types of deaths included in this section varied markedly with the changes in processing of deaths data that occurred in the period covered by this report (see Appendix A). This is demonstrated in the trends in numbers of deaths involving 3 mechanisms of injury (Figure 9.1).
The codes charted include deaths by mechanisms that are common in suicide and homicide: hanging, stabbing, and shooting. For all 3 mechanisms, there was an increase in numbers of deaths coded as ‘unintentional’ early in the decade followed by a sharp drop after 2004–05. The revised processing method applied to all deaths with a year of death 2005–06 or later and, in that period, few injury deaths with these mechanisms were recorded as being unintentional.
Deaths registered in 2006 provide the most direct indication of the effect of the changes in processing. The first release was processed before the changes were introduced, and the second release (used when preparing Figure 9.1) was processed after. The numbers of deaths coded to the 3 mechanisms shown in the Figure 9.1 in the first and second release of 2006 data were:
- W76 Other accidental hanging and strangulation—179 and 16
- W26 Contact with knife, sword or dagger—58 and 27
- W32–W34 Unintentional discharge of firearms—56 and 11.
Figure 9.1: Deaths involving mechanisms commonly associated with suicide and homicide, and recorded as unintentional, 1999–00 to 2016–17
Note: Data underpinning this figure are available in the supplementary table spreadsheet Table SF9.1.
Source: AIHW NMD.
Firearm-related deaths
Between 1999–00 to 2016–17, there were 318 unintentional firearm-related deaths, of which only 27 (less than 9%) were females (Table S.1). In the period before the ABS introduced its revised process (1999–00 to 2004–05), there was an average of about 36 deaths annually, while in the period following the change (2006–07 to 2016–17), there was an average of about 6 deaths annually (nearly all males). This suggests that, after the change, firearm-related deaths were more likely to be assigned as an intentional cause of death.