
Circumstances of homicide
Of the 161 male homicide deaths that occurred in 2016–17:
- 37% (60) involved Assault by a sharp object
- 19% (31) involved Assault by bodily force
- 15% (24) involved Assault by firearms.
Of the 73 female homicide deaths that occurred in 2016–17:
- 30% (21) involved Assault by a sharp object
- 14% (10) involved Assault by bodily force
- 10% (7) involved Assault by firearms.
How have homicide deaths changed over time?
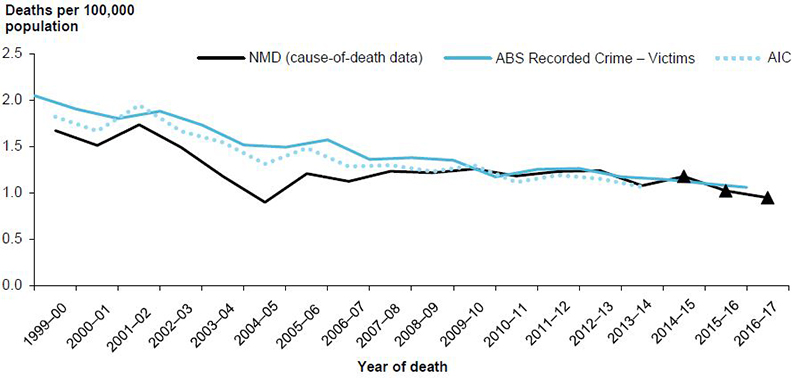
Crude rates of homicide, based on data from the NMD, fell from 1.7 deaths per 100,000 population in 2000–01 to 0.9 deaths per 100,000 in 2004–05, before rising to 1.2 deaths per 100,000 in 2005–06, then remaining steady (Figure 11.1).
Rates based on these data fell by an average of 10.6% per year from 1999–00 to 2004–05, and by an average of 2.3% per year from 1999–00 to 2016–17.
These changes need to be treated with caution, due to revisions in the way the ABS processes death registration data (see Appendix A). Changes in the revision process have been previously reported, focusing on homicides in 2004–05 (AIHW: Henley & Harrison 2009).
Estimates based on the NMD data are supplemented in this section by rates based on 2 other sources of data. Australian Institute of Criminology (AIC) homicide data indicate an average fall of 5.5% per year between 1999–00 and 2004–05, and a fall of 3.8% per year between 1999–00 and 2013–14.
Data on homicide and related offences from the ABS Recorded crime—victims, Australia publication series (ABS 2000–2017a) indicated an average rate of decrease of 3.7% per year over 1999–2016. Differences in case definitions and methods between the sources are such that identical rates should not be expected.
The main reason for using the supplementary sources is to assess whether the dip in ABS homicide counts, deepest in 2004–05, is evident in other sources. The ABS Recorded crime—victims, Australia publication series shows a nearly linear downward trend, with small fluctuations. The AIC homicide series shows a little more fluctuation, with a small dip in 2004–05. Neither supplementary series shows a dip as large as that evident in the NMD data.
All 3 series provide similar estimates for 2013–14, the latest year for which NMD data were essentially final at the time of writing, as well as the latest year for which AIC homicide data were available.
Crude rates were calculated for NMD data to allow better comparability with ABS-based and AIC-based estimates, and because there was little difference between crude and adjusted rates for the NMD data.
Figure 11.1: Crude rates of homicide deaths, 1999–00 to 2016–17
Notes:
- Values for the latest 3 years of NMD-based rates, shown as triangles, are subject to change due to later revisions of cause-of-death data by the ABS (see Appendix A for more information).
- Data underpinning this figure are available in the supplementary data spreadsheet Table SF11.1.
Source: AIHW NMD; AIC; ABS 2000–2017a.
Firearm-related homicides
Between 1999–00 and 2016–17, there were 665 firearm-related homicides, of which 175 (26%) were females (Table S.1). After the ABS revised its process (from 2006–07), the annual numbers of firearms-related homicides were higher than the number of homicides that would have been recorded using the pre-revisions processes.
Reasons for this are detailed in Appendix A and have previously been reported for 1999–2010 (AIHW: Harrison & Henley 2015).
Age and sex
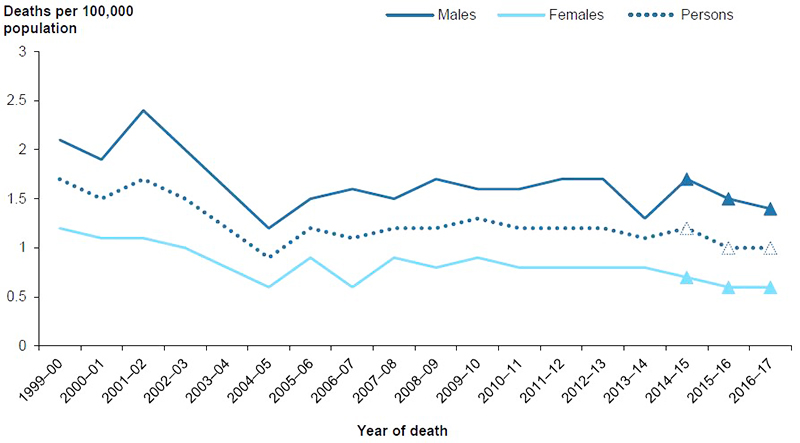
Age-standardised rates of homicides fell from 1.7 deaths per 100,000 population in 1999–00 to 0.9 deaths per 100,000 in 2004–05, then fluctuated between 1.0 and 1.3 deaths per 100,000.
The pattern was similar for both males and females, with rates declining between 1999–00 and 2004–05, then staying relatively steady, despite some fluctuations. Age-standardised rates of homicides for males were consistently 1.5–2.5 times the rates for females (Figure 11.2) (see the start of this section for cautionary notes on trends).
Figure 11.2: Age-standardised rates of homicide deaths, by sex, 1999–00 to 2016–17
Notes:
- Values for the latest 3 years, shown by triangles, are subject to change due to later revisions of cause-of-death data by the ABS (see Appendix A for more information).
- Data underpinning this figure are available in the supplementary table spreadsheet Table SF11.2.
Source: AIHW NMD.
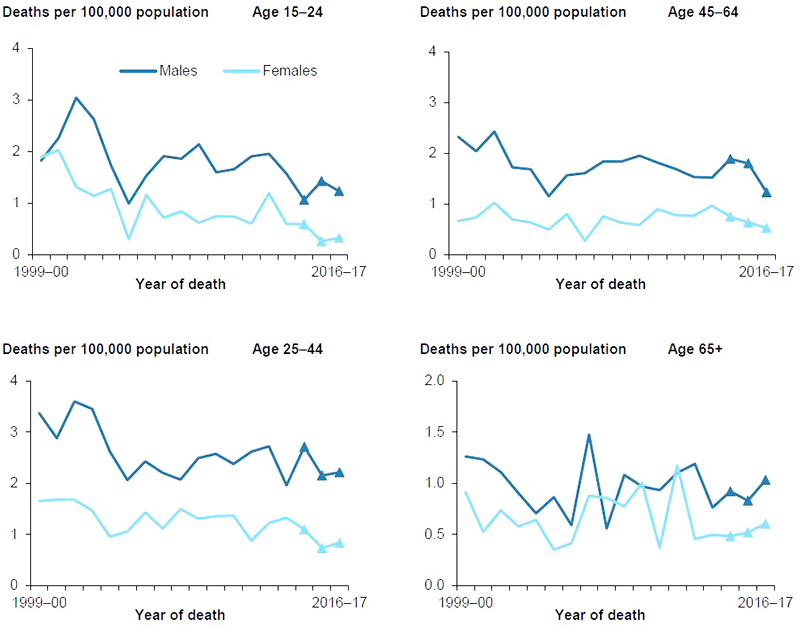
Figure 11.3 shows changes in homicide rates between 1999–00 and 2016–17 in each age group by sex.
Age-standardised rates for males were higher than for females across all age groups, for almost all years. There were downward trends over time for both males and females aged 15–24 and 25–44. There was a slight downward trend in rates for males aged 45–64, while for females aged 45–64 and those aged 65 and over, there were no discernible trends over time, despite large fluctuations resulting from relatively small year-to-year numbers.
Figure 11.3: Age-specific rates of homicide deaths, by age and sex, 1999–00 to 2016–17
Notes:
- Values for the latest 3 years, shown as triangles, are subject to change due to later revisions of cause-of-death data by the ABS (see Appendix A for more information).
- Data underpinning this figure are available in the supplementary table spreadsheet Table SF11.3.
- Rates for children aged 0–4 and 5–14 are not shown, due to small numbers.
Source: AIHW NMD
Remoteness of usual residence
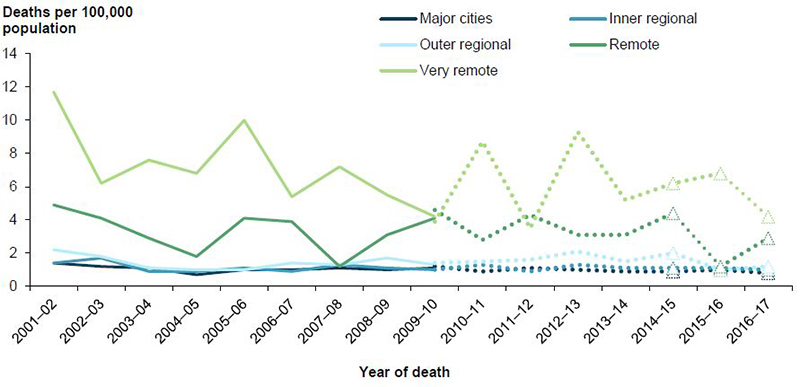
Between 2001–02 and 2016–17, rates of homicide deaths were consistently higher for residents of Very remote areas than for all other remoteness areas (Figure 11.4). Rates for residents of Remote areas were second highest in most years, while rates for residents of the Major cities, and Inner regional and Outer regional areas differed very little and were relatively steady over time.
The year-to-year fluctuation of rates for residents of Very remote and Remote areas is at least partly a reflection of the small population and number of incidents occurring each year.
Figure 11.4: Age-standardised rates of homicide deaths, by remoteness of usual residence, 2001–02 to 2016–17
Notes:
- Data for 1999-00 and 2000–01 were unavailable.
- Full lines are ASGC-based, while dotted lines are ASGS-based.
- Values for the latest 3 years, shown as triangles, are subject to change due to later revisions of cause-of-death data by the ABS (see Appendix A for more information).
- Data underpinning this figure are available in the supplementary table spreadsheet Table SF11.4.
Source: AIHW NMD.
Aboriginal and Torres Strait Islander people
Rates of homicide death for Aboriginal and Torres Strait Islander people fluctuated between 2001–02 and 2016–17, although there was no statistically significant trend (Figure 11.5). Rates for Aboriginal and Torres Strait Islander people were consistently 6–8 times as high as the rates for non-Indigenous Australians over this period.
Figure 11.5: Age-standardised rates of homicide deaths, by Indigenous status, 2001–02 to 2016–17
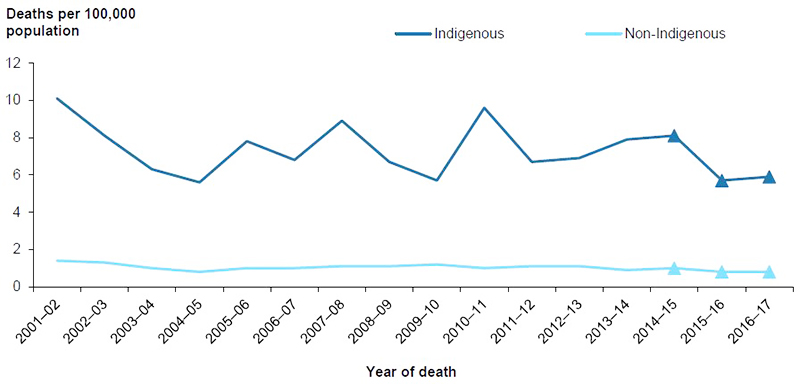
Notes:
- Data are for New South Wales, Queensland, Western Australia, South Australia, and the Northern Territory, the 5 jurisdictions for which recording of Indigenous status was considered to be of adequate quality throughout the study period.
- Values for the latest 3 years, shown as triangles, are subject to change due to later revisions of cause-of-death data by the ABS (see Appendix A for more information).
- Data underpinning this figure are available in the supplementary table spreadsheet Table SF11.5.
Source: AIHW NMD.