Falls
This section provides:
- a summary of all fall injury deaths in 2016–17 that are identifiable in the deaths data
- a statistical summary of unintentional fall injury deaths in that year
- a description of trends in unintentional fall injury deaths from 1999–00 to 2016–17.
What methods were used?
The criteria given in Methods were applied, and the records that included the following ICD-10 codes were included in this section:
- the UCoD was an Unintentional fall (W00–W19)
- the UCoD was coded as Exposure to unspecified factor (X59), and the MCoDs included a code for Fracture
- the MCoDs included codes for Unintentional fall (W00–W19) and for Injury (S00–T75 or T79)
- the MCoDs included codes for Exposure to unspecified factor (X59) and for Fracture.
The codes for fractures are S02, S12, S22, S32, S42, S52, S62, S72, S82, S92, T02, T08, T10, T12, and T14.2.
These criteria are the same as in previous reports (AIHW: Henley & Harrison 2009, 2015). Deaths with UCoD X59 and a fracture code as MCoD have been included routinely when reporting fall injury mortality, because of indications that most involve falls (Kreisfeld & Harrison 2005).
The 2 criteria that use an X59 code in combination with a fracture code accounted for 34% (1,679) of fall injury deaths reported for 2016–17. For more than 97% of deaths chosen by these criteria, the person was aged 65 and over, and for more than two-thirds (67%), the person was aged 85 and over. More than two-thirds of these deaths (69%) included a fracture of femur as MCoD.
It is possible that some of the deaths that were included using the X59 code and a fracture code might not be fall-related. But the inclusion of these 2 criteria provides a more accurate estimate of fall injury deaths than if they were excluded. For further background, see the sections on falls in previous reports (AIHW: Harrison & Henley 2015; AIHW: Henley & Harrison 2015).
Suicide and homicide deaths (UCoD X60–Y09) were excluded. The concepts underlying the abbreviations used in this section are defined in the Glossary.
Relevant terms and information about the data used in this section are summarised in boxes 1.1, 1.2, 1.3 and 7.1. Further information on methods is provided in Appendix A, and from a previously published report covering 1999–00 to 2009–10 (AIHW: Harrison & Henley 2015).
Box 7.1: External causes of falls
The Falls (W00–W19) section of Chapter XX External causes of morbidity and mortality of ICD-10 includes:
- Fall on same level involving ice and snow (W00)
- Fall on same level from slipping, tripping and stumbling (W01)
- Fall involving ice-skates, skis, roller-skates or skateboards (W02)
- Other fall on same level due to collision with, or pushing by, another person (W03)
- Fall while being carried or supported by other persons (W04)
- Fall involving wheelchair (W05)
- Fall involving bed (W06)
- Fall involving chair (W07)
- Fall involving other furniture (W08)
- Fall involving playground equipment (W09)
- Fall on and from stairs and steps (W10)
- Fall on and from ladder (W11)
- Fall on and from scaffolding (W12)
- Fall from, out of or through building or structure (W13)
- Fall from tree (W14)
- Fall from cliff (W15)
- Diving or jumping into water causing injury other than drowning or submersion (W16)
- Other fall from one level to another (W17)
- Other fall on same level (W18)
- Unspecified fall (W19).
Overview of fall injury deaths
Unintentional fall injury deaths accounted for 96% of all fall injury deaths in 2016–17 (Table 7.1). Falls attributed to Intentional self-harm, Assault, and those with Undetermined intent are not included in this section.
Table 7.1: All identifiable deaths involving falls, 2016–17
|
Terminology in this report |
Coverage in this report | ICD-10 codes | Number | % |
|---|---|---|---|---|
|
Unintentional falls(b) |
Falls |
UCoD W00–W19; or UCoD X59 and MCoD fracture; or MCoD W00–W19 and S00–T75, T79 or MCoD X59 and fracture(a) |
5,002 |
95.6 |
| Intentional self-harm involving fall | Suicide | UCoD X80 | 158 | 3.0 |
| Assault involving fall | Homicide | UCoD Y01 | 1 | 0.0 |
| Undetermined intent involving fall | Overview | UCoD Y30 | 13 | 0.2 |
| Fall from animal or animal- drawn vehicle | Transport crashes | UCoD V80.0 | 6 | 0.1 |
| Fall in or from railway train | Transport crashes | UCoD V81.5 or V81.6 | 0 | 0.0 |
| Drowning following fall into bathtub, swimming pool or natural water | Drowning | UCoD W66, W68 or W70 | 50 | 1.0 |
| Total fall injury deaths | 5,230 | 100.0 | ||
Notes:
- The 4 criteria include 2,742, 742, 581, and 1,682 deaths, respectively (745 deaths met more than 1 of the criteria).
- The codes for fractures are S02, S12, S22, S32, S42, S52, S62, S72, S82, S92, T02, T08, T10, T12, and T14.2.
Source: AIHW NMD.
How many deaths in 2016–17 were due to unintentional fall injury?
Unintentional falls were involved in 5,002 injury deaths (Table 7.2). This was more than 53% of all female injury deaths, and more than 28% of all male injury deaths for this period. Unintentional fall injury deaths for females were more than 1.2 times the number of deaths for males, although the age-standardised rate was higher for males.
Table 7.2: Key indicators for unintentional fall injury deaths, by sex, 2016–17
|
Indicator |
Males | Females | Persons |
|---|---|---|---|
|
Number |
2,231 |
2,771 |
5,002 |
| Percentage of all injury deaths | 28.1 | 53.2 | 38.1 |
| Crude rate (deaths per 100,000 population) | 18.4 | 22.5 | 20.5 |
| Age-standardised rate (deaths per 100,000 population) | 17.1 | 14.4 | 15.7 |
Source: AIHW NMD.
People aged 85 and over accounted for almost 63% of unintentional fall injury deaths, while those aged 75–84 accounted for a further 24% (Table 7.3).
Table 7.3: Unintentional fall injury deaths, by age and sex, 2016–17
|
Age group |
Males |
Females | Persons | |||
|---|---|---|---|---|---|---|
| Number | % | Number | % | Number | % | |
|
0–4 |
1 |
0.0 |
0 |
0.0 |
1 |
0.0 |
| 5–14 | 0 | 0.0 | 0 | 0.0 | 0 | 0.0 |
| 15–24 | 13 | 0.6 | 2 | 0.1 | 15 | 0.3 |
| 25–44 | 33 | 1.5 | 15 | 0.5 | 48 | 1.0 |
| 45–64 | 143 | 6.4 | 67 | 2.4 | 210 | 4.2 |
| 65-74 | 236 | 10.6 | 150 | 5.4 | 386 | 7.7 |
| 75-84 | 633 | 28.4 | 579 | 20.9 | 1,212 | 24.2 |
| 85+ | 1,172 | 52.5 | 1,958 | 70.7 | 3,130 | 62.6 |
| Total | 2,231 | 100.0 | 2,771 | 100.0 | 5,002 | 100.0 |
Source: AIHW NMD.
State or territory of usual residence
The age-standardised rate of unintentional fall injury deaths for residents of the Northern Territory (26 per 100,000 population) was more than 1.6 times the national rate (15.7 deaths per 100,000) (Table 7.4). Most other jurisdictions recorded rates close to or over the national rate, with residents of New South Wales recording the lowest rate (14.5 deaths per 100,000).
Table 7.4: Unintentional fall injury deaths, by state/territory of usual residence, 2016–17
|
Indicator |
State/territory of usual residence | |||||||
|---|---|---|---|---|---|---|---|---|
| NSW | VIC | QLD | WA | SA | TAS | ACT | NT | |
|
Number |
1,568 |
1,370 | 925 | 464 | 427 | 133 | 86 | 29 |
|
% |
31.3 |
27.4 | 18.5 | 9.3 | 8.5 | 2.7 | 1.7 | 0.6 |
|
Age-standardised rate |
14.5 |
16.4 | 16.0 | 16.2 | 15.3 | 17.0 | 21.0 | 25.7 |
Source: AIHW NMD.
Remoteness of usual residence
Age-standardised rates of unintentional fall injury deaths were similar across all remoteness areas except for Very remote areas where rates were noticeably higher (Table 7.5).
Table 7.5: Unintentional fall injury deaths, by remoteness of usual residence, 2016–17
|
Indicators |
Remoteness of usual residence(b) | ||||
|---|---|---|---|---|---|
| Major cities | Inner regional | Outer regional | Remote | Very remote | |
|
Number(a) |
3,302 |
1,139 | 493 | 42 | 19 |
|
% |
66.1 |
22.8 | 9.9 | 0.8 | 0.4 |
|
Age-standardised rate |
15.1 |
16.7 | 17.6 | 15.5 | 21.5 |
Notes:
- Excludes 8 deaths where remoteness was not reported.
- Derived using the Australian Statistical Geography Standard (ASGS) classification.
Source: AIHW NMD.
Socioeconomic area
Age-standardised rates of unintentional fall injury deaths were similar across socioeconomic areas (Table 7.6). The highest rate was recorded for residents of second lowest socioeconomic area (17.4 deaths per 100,000 population).
Table 7.6: Unintentional fall injury deaths, by socioeconomic area, 2016–17
|
Indicator |
Socioeconomic area | ||||
|---|---|---|---|---|---|
| 1—lowest | 2 | 3 | 4 | 5—highest | |
|
Number |
1,019 |
1,229 | 1,017 | 849 | 879 |
|
% |
20.4 |
24.6 | 20.3 | 17.0 | 17.6 |
|
Age-standardised rate |
14.7 |
17.4 | 16.5 | 14.9 | 14.5 |
Note: Excludes 9 deaths where socioeconomic area was not reported.
Source: AIHW NMD.
Aboriginal and Torres Strait Islander people
The age-standardised rate for unintentional fall injury deaths for Aboriginal and Torres Strait Islander people was 1.5 times the rate for non-Indigenous Australians (Table 7.7).
Table 7.7: Key indicators for unintentional fall injury deaths, by Indigenous status and sex, 2016–17
|
Indicator |
Indigenous |
Non-Indigenous | ||||
|---|---|---|---|---|---|---|
| Males | Females | Persons | Males | Females | Persons | |
| Number |
19 |
23 | 42 | 1,495 | 1,838 | 3.333 |
| Age-standardised rate (deaths per 100,000 population) |
21.9 |
22.8 | 22.5 | 16.4 | 13.7 | 15.0 |
|
Rate ratio(a) |
1.3 |
1.7 | 1.5 | . . | . . | . . |
| Rate difference(b) |
5.5 |
9.1 | 7.5 | . . | . . | . . |
Notes:
- Rate ratios are standardised rates for Indigenous males, females, and persons, divided by standardised rates for non-Indigenous males, females, and persons.
- Rate differences are standardised rates for Indigenous males, females, and persons, minus standardised rates for non-Indigenous males, females, and persons.
Includes data for New South Wales, Queensland, Western Australia, South Australia, and the Northern Territory (see Box 1.2).
Source: AIHW NMD.
How have unintentional fall injury deaths changed over time?
Between 1999–00 and 2016–17, age-standardised rates for unintentional fall injury deaths remained relatively steady (Figure 7.1).
Age and sex
Rates fluctuated a little for both males and females over the period, but with no apparent trend. Rates for males were consistently 1.1–1.2 times as high as rates for females.
While age-adjusted rates have not varied greatly, the number of deaths has risen from 2,628 in 1999–00 to just over 5,000 in 2016–17. This largely reflects growth in the older part of the Australian population, in which rates of fall-related injury are high.
Figure 7.1: Age-standardised rates of unintentional fall injury deaths, by sex, 1999–00 to 2016–17
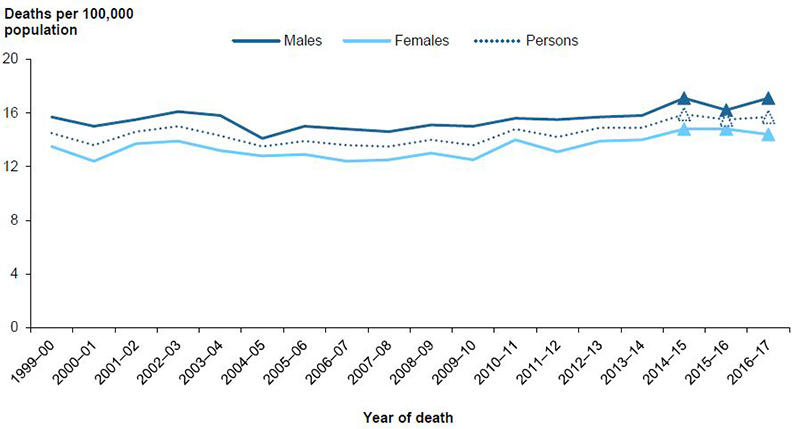
Notes:
- Values for the latest 3 years, shown as triangles, are subject to change due to later revisions of cause-of-death data by the ABS (see Appendix A for more information).
- Data underpinning this figure are available in the supplementary table spreadsheet Table SF7.1.
Source: AIHW NMD.
Figure 7.2 shows changes in fall injury death rates between 1999–00 to 2016–17 in each age group by sex.
Age-specific rates for males were higher than female rates for those aged 15–24, 25–44, and 45–64, while rates for women were higher than men among those aged 65 and over.
Rates for males aged 15–24 and 25–44 declined over time, while rates for males in the 2 oldest age groups rose over time.
Rates for women aged 25–44 and 45–64 were relatively steady over time despite some fluctuations, while rates for women aged 65 and over rose over time at a rate similar to males in the same age group.
Rates for children aged 0–14 and women aged 15–24 are not shown, due to small numbers.
Figure 7.2: Age-specific rates of unintentional fall injury deaths, by age and sex, 1999–00 to 2016–17
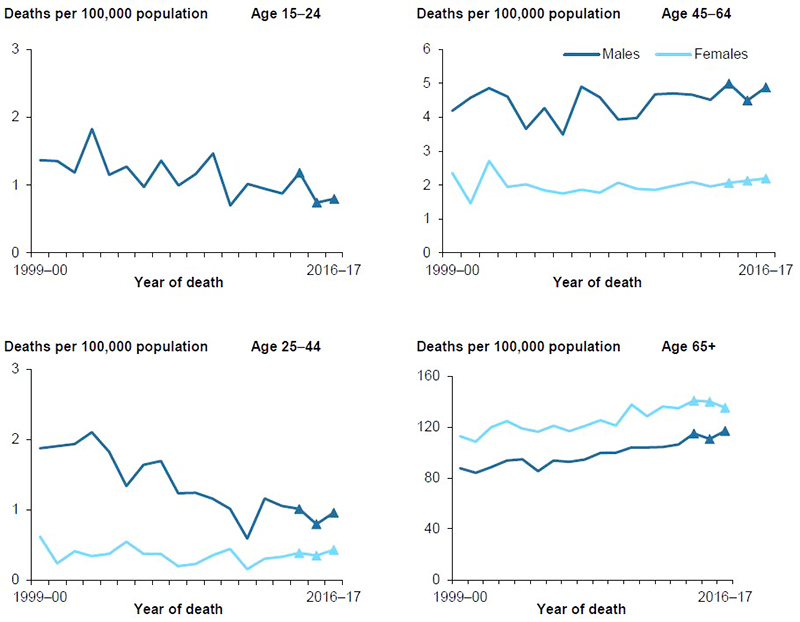
Notes:
- Values for the latest 3 years, shown as triangles, are subject to change due to later revisions of cause-of-death data by the ABS (see Appendix A for more information).
- Data underpinning this figure are available in the supplementary table spreadsheet Table SF7.2.
- Rates for children aged 0–4 and 5–14 and for females aged 15–24, are not shown, due to small numbers.
Source: AIHW NMD.
Figure 7.3 shows a comparison of age-specific and age-standardised rates of unintentional fall injury deaths for people aged 65 and over between 1999–00 and 2016–17.
Although the pattern for both rates was similar over time, the rise for the age-standardised rate was much less than the rise for the age-specific rate. This difference is most likely due to the higher increases over time in the number of deaths in older ages—such as those aged 85 and over—than in those aged 65–84.
Figure 7.3: Unintentional fall injury deaths for people aged 65 and over, by age-specific and age-standardised rates, 1999–00 to 2016–17
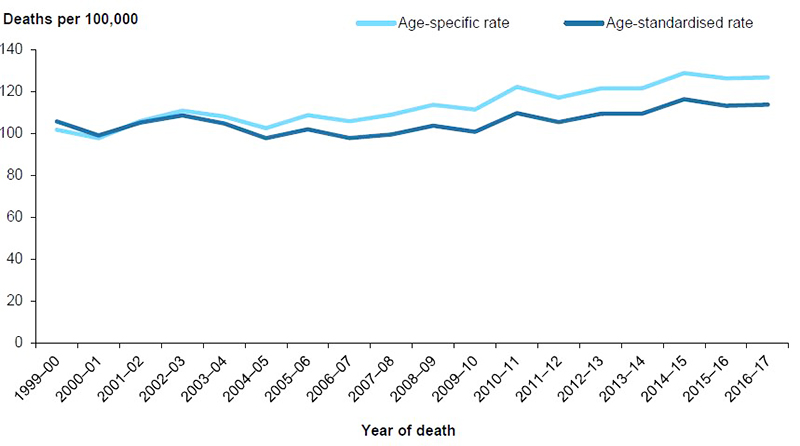
Source: AIHW NMD.
Remoteness of usual residence
Between 2001–02 and 2016–17, rates of unintentional fall injury deaths were generally more similar for residents of all remoteness areas than was the case for other external causes of injury (Figure 7.4).
Rates were relatively steady over time, regardless of the remoteness of the person’s usual place of residence. The fluctuation for residents of Very remote regions partly reflects the small population and number of deaths occurring each year.
In 2009–10, the only year for which both ASGC-based and ASGS-based rates are shown, the ASGC-based rate for Remote areas was higher than the ASGS-based rate, while for Very remote areas, the ASGS-based rate was higher.
See Appendix A for more information of the ASGC and ASGS classification systems.
Figure 7.4: Age-standardised rates of unintentional fall injury deaths, by remoteness of usual residence, 2001–02 to 2016–17
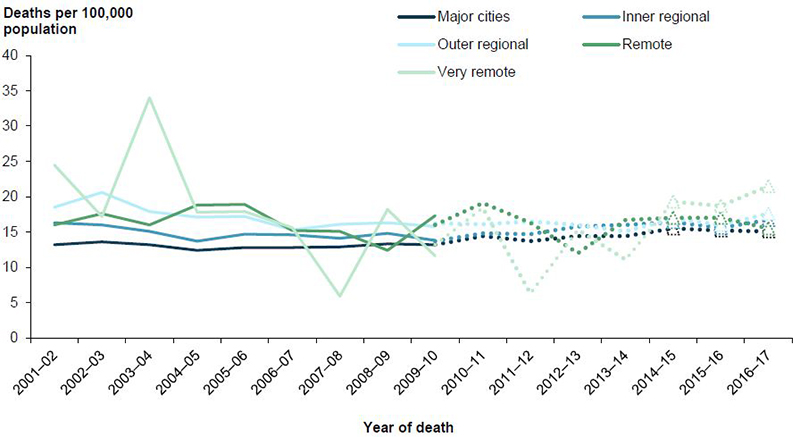
Notes:
- Data for 1999-00 and 2000–01 were unavailable.
- Full lines are ASGC-based, while dotted lines are ASGS-based.
- Values for the latest 3 years, shown as triangles, are subject to change due to later revisions of cause-of-death data by the ABS (see Appendix A for more information).
- Data underpinning this figure are available in the supplementary table spreadsheet Table SF7.3.
Source: AIHW NMD.
Aboriginal and Torres Strait Islander people
Age-standardised rates of unintentional fall injury deaths for Aboriginal and Torres Strait Islander people fluctuated markedly from year to year between 2001–02 and 2016–17, with no statistically significant change (Figure 7.5).
The rates varied from 1–2 times the rates for non-Indigenous Australians over the period.
Changes in rates for Aboriginal and Torres Strait Islander peoples over time need to be treated with caution, due to the relatively low numbers of deaths annually.
Figure 7.5: Age-standardised rates of unintentional fall injury deaths, by Indigenous status, 2001–02 to 2016–17
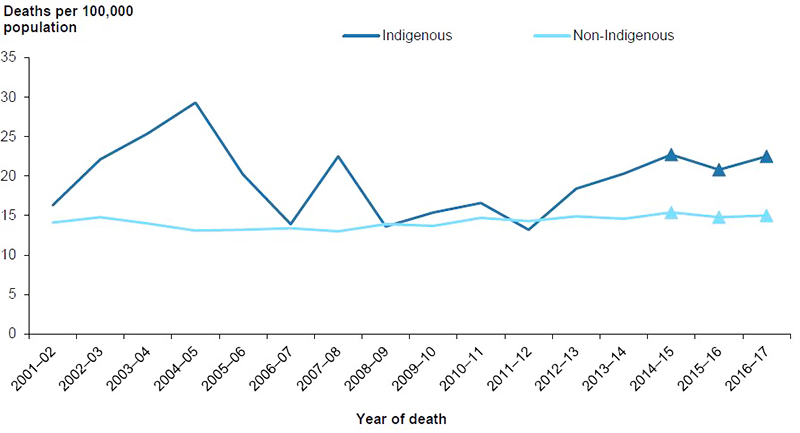
Notes:
- Data are for New South Wales, Queensland, Western Australia, South Australia, and the Northern Territory, the 5 jurisdictions for which recording of Indigenous status was considered to be of adequate quality throughout the study period.
- Values for the latest 3 years, shown as triangles, are subject to change due to later revisions of cause-of-death data by the ABS (see Appendix A for more information).
- Data underpinning this figure are available in the supplementary table spreadsheet Table SF7.4.
Source: AIHW NMD.