
Types of pharmaceuticals
Of unintentional poisoning deaths involving pharmaceuticals:
- more than 74% (1,034) involved Poisoning by narcotics and psychodysleptics [hallucinogens] (735 males; 299 females), of which:
- 39% (399) were Poisoning by heroin
- 39% (402) were Poisoning by other opioids
- 21% (212) were Poisoning by methadone
- more than 74% (767) were among people aged 30–54
- more than 52% (727) involved Poisoning by psychotropic drugs, not elsewhere classified
- (503 males; 224 females), of which:
- 46% (337) involved Poisoning by antidepressants
- 51% (368) involved Psychostimulants with potential use for disorder
- about 73% (531) were among people aged 30–54
- more than 45% (631) involved Poisoning by antiepileptic, sedative-hypnotic and antiparkinsonism drugs (429 males; 202 females), of which:
- 92% (581) involved Poisoning by benzodiazepines
- just over 73% (462) were among people aged 30–54.
How have unintentional poisoning deaths involving pharmaceuticals changed over time?
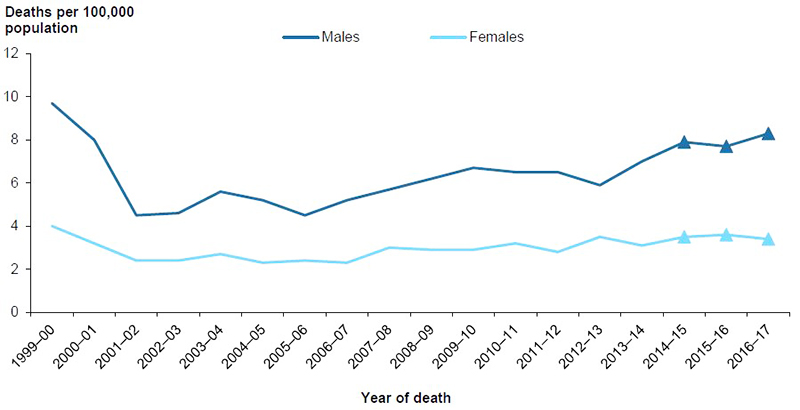
Age-standardised rates for unintentional poisoning deaths involving pharmaceuticals fell dramatically between 1999–00 and 2001–02, from 6.9 to 3.4 deaths per 100,000 population, for both males and females (Figure 5.1). This was most likely due to a reduction in the supply of opiate narcotics (chiefly heroin), with an abrupt onset in all Australian jurisdictions in early 2001 (Degenhardt et al. 2006). Rates increased by an annual average of 2.7% per year between 2001–02 and 2016–17.
Age and sex
Rates for males were at their lowest between 2001–02 and 2005–06, before rising to 8.3 deaths per 100,000 population in 2016–17. Rates for females were at their lowest between 2001–02 and 2006–07, rising in 2007–08, then remaining relatively steady. Between 1999–00 and 2016–17, rates for males were consistently 2–2.5 times as high as for females.
Figure 5.1: Age-standardised rates of unintentional poisoning deaths involving pharmaceuticals, by sex, 1999–00 to 2016–17
Notes:
- Values for the latest 3 years, shown as triangles, are subject to change due to later revisions of cause-of-death data by the ABS (see Appendix A for more information).
- Data underpinning this figure are available in the supplementary table spreadsheet Table SF5.1.
Source: AIHW NMD.
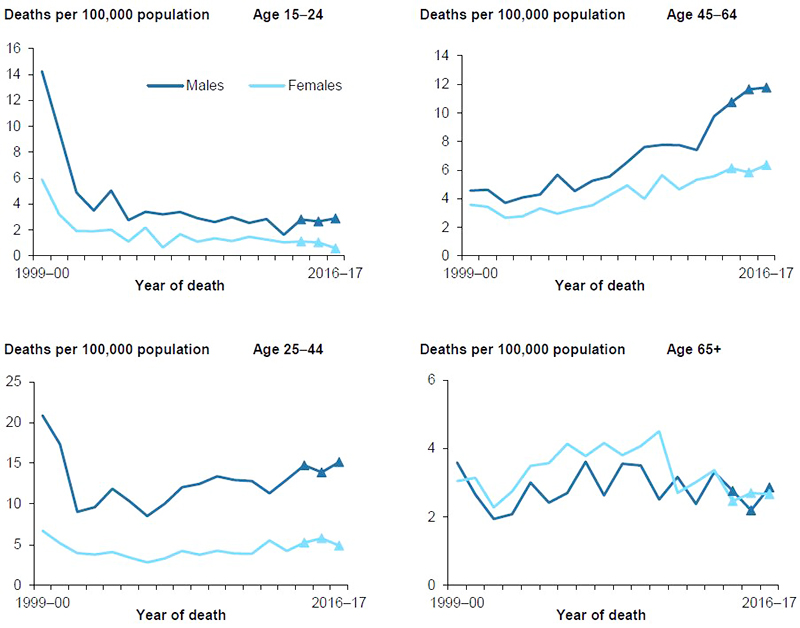
Figure 5.2 shows changes in age-standardised rates for unintentional poisoning deaths involving pharmaceuticals between 1999–00 and 2016–17 in each age group by sex.
Rates for males were higher than for females for most age groups, except among those aged 65 and over whose rates for men were about the same as rates for women.
There were marked decreases in rates for males aged 15–24 and 25–44 in the first 2 years of the period. Female rates also decreased in those 2 years for females in these age groups, but this was less marked than for males. Rates for both men and women aged 25–44 and 45–64 rose between 2001–02 and 2016–17.
Figure 5.2: Age-specific rates of unintentional poisoning deaths involving pharmaceuticals, by age and sex, 1999–00 to 2016–17
Notes:
- Values for the latest 3 years, shown as triangles, are subject to change due to later revisions of cause-of-death data by the ABS (see Appendix A for more information).
- Data underpinning this figure are available in the supplementary table spreadsheet Table SF5.2.
- Rates for children aged 0–4 and 5–14 are not shown, due to small numbers.
Source: AIHW NMD.
Remoteness of usual residence
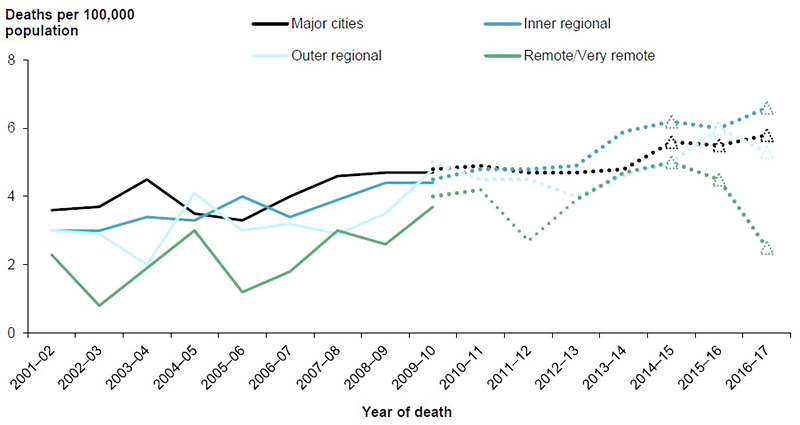
Between 2001–02 and 2016–17, rates of unintentional poisoning deaths involving pharmaceuticals were broadly similar across all remoteness areas (Figure 5.3). With a few exceptions, rates for residents of Remote and very remote areas (combined, due to small case numbers) were lower than for residents of less remote areas.
Rates increased over time for all remoteness areas, although the rate in Remote and very remote areas was sensitive to small changes in the annual number of cases.
In 2009–10, the only year for which both ASGC-based and ASGS-based rates are shown, ASGS-based rates were higher than the ASGC-based rates in Outer regional and Remote and very remote areas.
See Appendix A for more information of the ASGC and ASGS classification systems.
Figure 5.3: Age-standardised rates of unintentional poisoning deaths involving pharmaceuticals, by remoteness of usual residence, 2001–02 to 2016–17
Notes:
- Data for 1999−00 and 2000–01 were unavailable.
- The rates for Remote and very remote areas are combined, due to small numbers.
- Full lines are ASGC-based, while dotted lines are ASGS-based.
- Values for the latest 3 years, shown as triangles, are subject to change due to later revisions of cause-of-death data by the ABS (see Appendix A for more information).
- Data underpinning this figure are available in the supplementary table spreadsheet Table SF5.3.
Source: AIHW NMD.
Aboriginal and Torres Strait Islander people
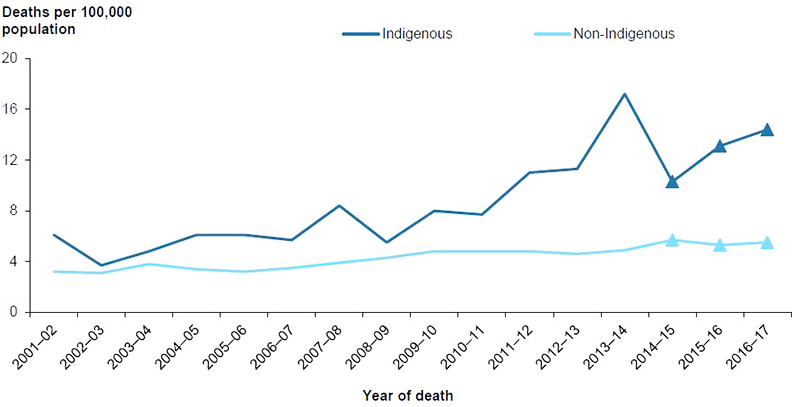
Age-standardised rates of unintentional poisoning deaths involving pharmaceuticals for Aboriginal and Torres Strait Islander people rose by an average of 6.8% per year between 2001–02 and 2016–17 (Figure 5.4). Over the same period, rates for non-Indigenous Australians increased by an average of 3.3% per year.
Rates for Aboriginal and Torres Strait Islander people varied between 1.2–3.5 times as high as rates for non-Indigenous Australians over this period.
Figure 5.4: Age-standardised rates of unintentional poisoning deaths involving pharmaceuticals, by Indigenous status, 2001–02 to 2016–17
Notes:
- Data are for New South Wales, Queensland, Western Australia, South Australia, and the Northern Territory, the 5 jurisdictions for which recording of Indigenous status was considered to be of adequate quality throughout the study period.
- Values for the latest 3 years, shown as triangles, are subject to change due to later revisions of cause-of-death data by the ABS (see Appendix A for more information).
- Data underpinning this figure are available in the supplementary table spreadsheet Table SF5.4.
Source: AIHW NMD.
Reporting on drugs of public interest
ICD-10, the classification applied to case data in the main data source used in this report (the NMD), has categories that distinguish some drugs (for example, heroin and cocaine) but not others, including some that have become the subject of public interest (for example, oxycodone).
ICD-10 provides a way to code deaths that involved any type of poison, but mostly to categories that are non-specific. For example, coders are instructed to assign cases involving oxycodone to category T40.2 Other opioids, which is also the category for cases involving codeine and morphine. As a result, when using only ICD-10 coded mortality data, there is no way to determine how many deaths were recorded as having involved a drug such as oxycodone.
The NCIS, which is used as a supplementary source in this report, allows specific coding of oxycodone and many other substances, and allows access, for many cases, to the police report to the coroner, investigation, autopsy, and toxicology reports and the coroner’s findings. A preliminary investigation into use of that source to provide more detailed information on selected drugs was done while preparing this report. Findings were promising, but it was concluded that further work is required before the method is ready for use in reports like this one.