
How have injury deaths changed over time?
Between 1999–00 and 2016–17, injury deaths have comprised a fairly constant proportion of all deaths in Australia, ranging from 7.4% to 8.2% (Figure 2.1).
Figure 2.1: Deaths from injury and from all causes, 1999–00 to 2016–17
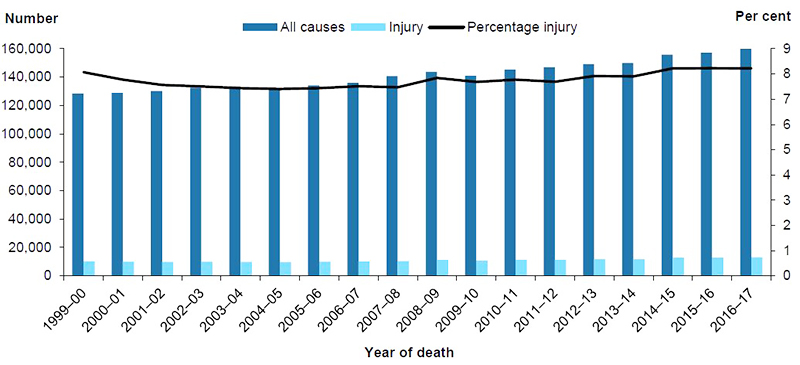
Note: Data underpinning this figure are available in the supplementary table spreadsheet Table SF2.1.
Source: AIHW NMD.
Age and sex
Age-standardised rates of injury deaths fell from 55.4 to 47.2 per 100,000 population between 1999–00 and 2004–05, with little change in more recent years (Figure 2.2).
Rates for both males and females also declined from the start of the reported period until 2004–05, then remained relatively steady. Age-standardised rates for males were consistently more than double the rates for females.
Figure 2.2: Age-standardised rates of injury deaths, by sex, 1999–00 to 2016–17
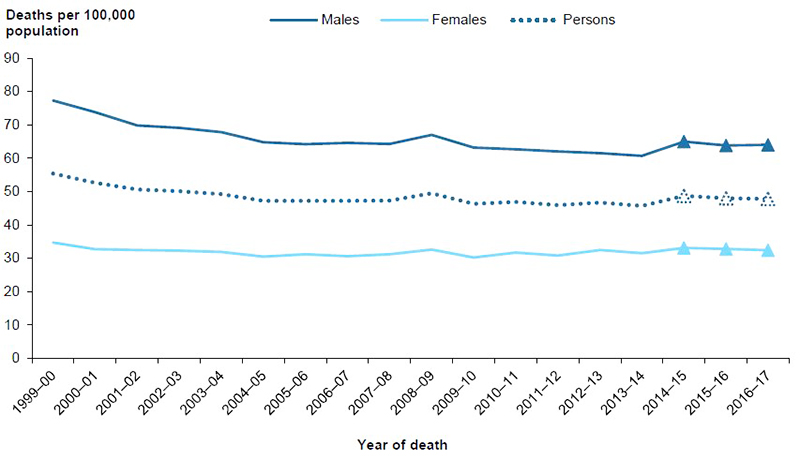
Notes:
- Values for the latest 3 years, shown as triangles, are subject to change due to later revisions of cause-of-death data by the ABS (see Appendix A for more information).
- Data underpinning this figure are available in the supplementary table spreadsheet Table SF2.2.
Source: AIHW NMD.
Figure 2.3 shows changes in injury death rates between 1999–00 and 2016–17 in each age group by sex. In nearly all instances, age-specific rates for males were higher than for females, though differences were relatively small for the youngest and oldest age groups.
A downward trend in rates was seen for both males and females in the 3 youngest age groups, and for males aged 25–44. But rates for males in these age groups were steady or increased late in the period.
Rates for both males and females in the 2 oldest age groups rose slowly over the period.
Overall, rates were much higher for those aged 65 and over than for other age groups, while children aged 5–14 had the lowest rate.
Figure 2.3: Age-specific rates of injury deaths, by age and sex, 1999–00 to 2016–17
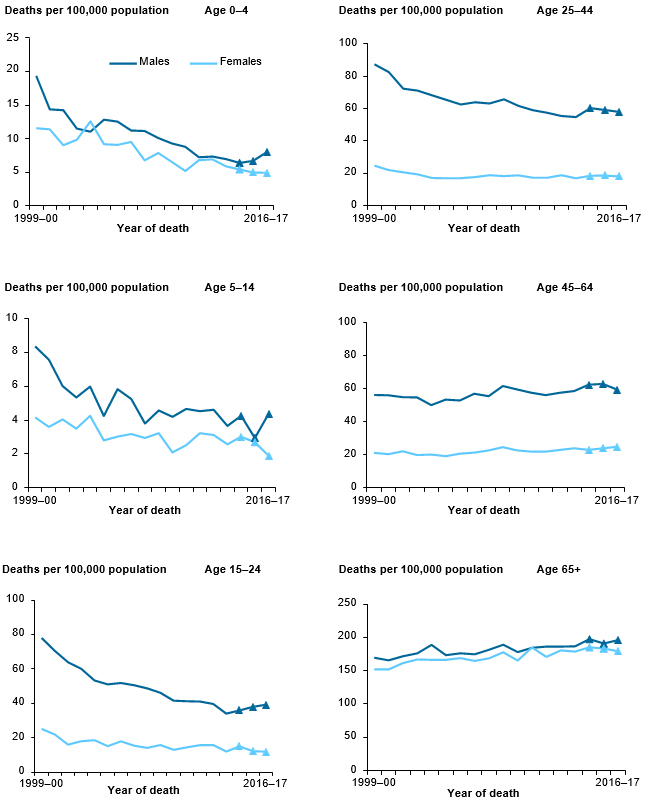
Notes:
- Values for the latest 3 years, shown as triangles, are subject to change due to later revisions of cause-of-death data by the ABS (see Appendix A for more information).
- Data underpinning this figure are available in the supplementary table spreadsheet Table SF2.3.
Source: AIHW NMD.
Remoteness of usual residence
Rates of injury deaths rose with increasing remoteness of place of usual residence. Rates were higher for residents of Very remote areas than for residents of other remoteness areas between 2001–02 and 2016–17 (Figure 2.4).
There was a downward trend in rates for residents of Very remote areas between 2001–02 and 2009–10, after which rates began to rise again. Rates for the residents of the other remoteness areas remained relatively steady over time.
Figure 2.4: Age-standardised rates of injury deaths, by remoteness of usual residence, 2001–02 to 2016–17
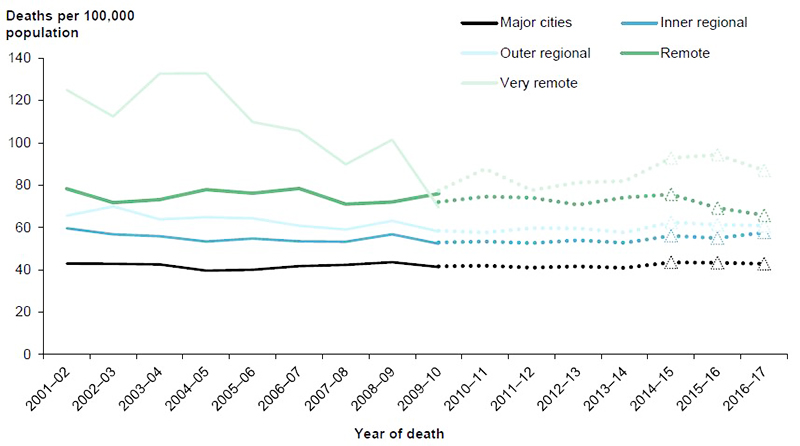
Notes:
- Data for 1999-00 and 2000–01 were unavailable.
- Full lines are based on the Australian Standard Geographical Classification (ASGC), while dotted lines are ASGS-based.
- Values for the latest 3 years, shown as triangles, are subject to change due to later revisions of cause-of-death data by the ABS (see Appendix A for more information).
- Data underpinning this figure are available in the supplementary table spreadsheet Table SF2.4.
Source: AIHW NMD.
Aboriginal and Torres Strait Islander people
Except for 2008–09 and 2009–10, age-standardised rates of injury deaths for Aboriginal and Torres Strait Islander people were consistently at least twice as high as rates for non-Indigenous Australians between 2001–02 and 2016–17 (Figure 2.5).
Despite some fluctuations, rates for both Indigenous and non-Indigenous Australians remained relatively steady over time.
Figure 2.5: Age-standardised rates of injury deaths, by Indigenous status, 2001–02 to 2016–17
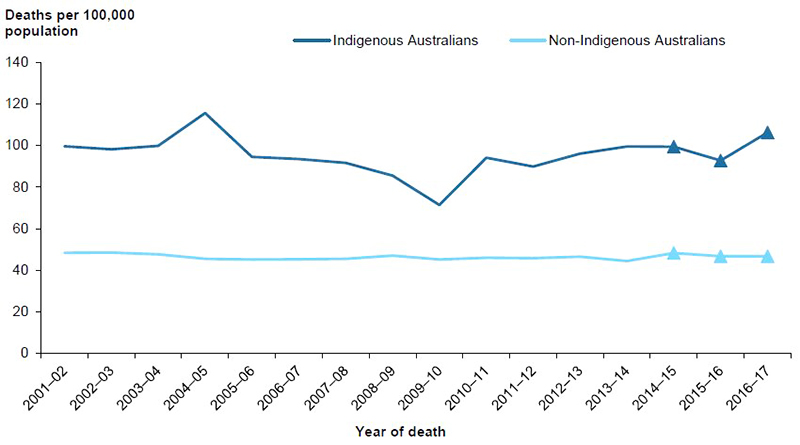
Notes:
- Data are for New South Wales, Queensland, Western Australia, South Australia, and the Northern Territory, the 5 jurisdictions for which recording of Indigenous status was considered to be of adequate quality throughout the study period.
- Values for the latest 3 years, shown as triangles, are subject to change due to later revisions of cause-of-death data by the ABS (see Appendix A for more information).
- Data underpinning this figure are available in the supplementary table spreadsheet Table SF2.5.
Source: AIHW NMD.