
Poisoning by other substances
This chapter provides:
- a summary of all poisoning deaths involving substances other than pharmaceuticals in 2016–17 that are identifiable in the deaths data
- a statistical summary of unintentional poisoning deaths involving substances other than pharmaceuticals in that year
- a description of trends in unintentional poisoning deaths involving substances other than pharmaceuticals from 1999–00 to 2016–17.
What methods were used?
The criteria given in Section 1.3 were applied, and the records that included the following ICD-10 codes were included in this chapter:
- the UCoD was Unintentional poisoning by substances other than pharmaceuticals (X45–X49)
- the MCoDs included codes for Unintentional poisoning by substances other than pharmaceuticals (X45–X49) and for Injury (S00–T75 or T79)
- the MCoDs included codes for Toxic effects of substances other than pharmaceuticals (T51–T65) and for External causes of unintentional injury (V01–X59).
Suicide and homicide deaths (UCoD X60–Y09) were excluded. The concepts underlying the abbreviations used in this section are defined in the Glossary.
Relevant terms and information about the data used in this chapter are summarised in boxes 1.1, 1.2, 1.3 and 6.1. Further information on methods is provided in Appendix A.
Box 6.1: External causes of poisoning by other substances
Accidental poisoning by and exposure to noxious substances (X40–X49) is the subject of a section of Chapter XX External causes of morbidity and mortality of ICD-10. The second set of categories in this section refer to poisoning by, and exposure to, drugs, medicaments, and biological substances (X45–X49):
- Accidental poisoning by and exposure to alcohol (X45)
- Accidental poisoning by and exposure to organic solvents and halogenated hydrocarbons and their vapours (X46)
- Accidental poisoning by and exposure to other gases and vapours (X47)
- Accidental poisoning by and exposure to pesticides (X48)
- Accidental poisoning by and exposure to other and unspecified chemicals and noxious substances (X49).
Overview of poisoning deaths involving other substances
Unintentional cases accounted for 56% of all poisoning deaths involving other substances (Table 6.1). Another 41% of the deaths were by intentional self-harm; these and deaths due to Assault or with Undetermined intent are not included in the remainder of this chapter.
Table 6.1: All identifiable poisoning deaths involving other substances, 2016–17
|
Terminology in this report |
Coverage in this report | ICD-10 codes | Number | % |
|---|---|---|---|---|
|
Unintentional poisoning by other substances |
Poisoning by other substances (Chapter 6) |
UCoD X45–X49; or MCoD X45–X49 and S00–T75, T79; or MCoD T51–T65 and V01–X59 |
373 |
56.2 |
| Intentional self-harm poisoning by other substances | Suicide (Chapter 10) | UCoD X65–X69; or MCoD X65–X69 and S00–T75, T79 | 273 | 41.1 |
| Assault, poisoning by other substances | Homicide (Chapter 11) | UCoD X86–X90; or MCoD X86–X90 and S00–T75, T79 | 3 | 0.5 |
| Poisoning by other substances, undetermined intent | Undetermined intent (Chapter 2) | UCoD Y15–Y19; or MCoD Y15–Y19 and S00–T75, T79 | 15 | 2.3 |
| Total poisoning by other substances deaths | 664 | 100.0 | ||
Source: AIHW NMD.
How many deaths in 2016–17 were due to unintentional poisoning involving other substances?
Unintentional poisoning deaths involving other substances accounted for 373 injury deaths, 2.8% of all injury death for this period (Table 6.2). Almost 2.8 times as many males as females died as a result of unintentional poisoning by other substances.
Table 6.2: Key indicators for unintentional poisoning deaths involving other substances, by sex, 2016–17
|
Indicator |
Males | Females | Persons |
|---|---|---|---|
|
Number |
274 |
99 |
373 |
| Percentage of all injury deaths | 3.5 | 1.9 | 2.8 |
| Crude rate (deaths per 100,000 population) | 2.3 | 0.8 | 1.5 |
| Age-standardised rate (deaths per 100,000 population) | 2.3 | 0.8 | 1.5 |
Source: AIHW NMD.
People aged 25–64 accounted for 85% of all unintentional poisoning deaths involving other substances (Table 6.3), compared with just 39% of all injury deaths. The proportion of deaths was higher for females than males in the 2 oldest age groups.
Table 6.3: Unintentional poisoning deaths involving other substances, by age and sex, 2016–17
|
Age group |
Males |
Females | Persons | |||
|---|---|---|---|---|---|---|
| Number | % | Number | % | Number | % | |
|
0–4 |
0 |
0.0 |
0 |
0.0 |
0 |
0.0 |
| 5–14 | 0 | 0.0 | 3 | 3.0 | 3 | 0.8 |
| 15–24 | 12 | 4.4 | 1 | 1.0 | 13 | 3.5 |
| 25–44 | 123 | 44.9 | 34 | 34.3 | 157 | 42.1 |
| 45–64 | 113 | 41.2 | 48 | 48.5 | 161 | 43.2 |
| 65+ | 26 | 9.5 | 13 | 31.1 | 39 | 10.5 |
| Total | 274 | 100.0 | 99 | 100.0 | 373 | 100.0 |
Source: AIHW NMD.
State or territory of usual residence
The age-standardised rate for unintentional poisoning deaths involving other substances was highest for residents of the Northern Territory (6.9 deaths per 100,000 population), which was 4.6 times the national rate of 1.5 deaths per 100,000 (Table 6.4). Tasmania recorded the second highest rate (2.0 deaths per 100,000), while South Australia recorded the lowest rate (1.1 deaths per 100,000).
Table 6.4: Unintentional poisoning deaths involving other substances, by state/territory of usual residence, 2016–17
|
Indicator |
State/territory of usual residence | |||||||
|---|---|---|---|---|---|---|---|---|
| NSW | VIC | QLD | WA | SA | TAS | ACT | NT | |
|
Number |
130 |
93 | 55 | 44 | 18 | 12 | 5 | 16 |
|
% |
34.9 |
24.9 | 14.7 | 11.8 | 4.8 | 3.2 | 1.3 | 4.3 |
|
Age-standardised rate |
1.7 |
1.5 | 1.2 | 1.7 | 1.1 | 2.0 | 1.3 | 6.9 |
Source: AIHW NMD.
Remoteness of usual residence
The rate of unintentional poisoning deaths involving other substances rose with increasing remoteness of usual place of residence (Table 6.5). The rate for residents of Very remote areas (3.1 deaths per 100,000 population) was 2.4 times as high as the rate for residents of Major cities (1.3 deaths per 100,000). These results should be treated with caution due to the relatively small numbers in Remote and Very remote areas, which can result in marked year-to-year variability.
Table 6.5: Unintentional poisoning deaths involving other substances, by remoteness of usual residence, 2016–17
|
Indicators |
Remoteness of usual residence(b) | ||||
|---|---|---|---|---|---|
|
Major cities |
Inner regional | Outer regional | Remote | Very remote | |
|
Number(a) |
234 |
76 |
42 |
8 |
6 |
| % | 64.0 | 20.8 | 11.4 | 2.2 | 1.6 |
| Age-standardised rate (deaths per 100,000 population) | 1.3 | 1.8 | 2.0 | 3.0 | 3.1 |
Notes:
- Excludes 8 deaths where remoteness was not reported.
- Derived using the ASGS classification.
Source: AIHW NMD.
Socioeconomic area
The age-standardised rate of unintentional poisoning deaths involving other substances rose with increasing disadvantage (Table 6.6). The rates for residents of the 3 middle socioeconomic areas were similar, while the rate for those living in the lowest socioeconomic areas (2.0 deaths per 100,000 population) was twice as high as for people living in the highest socioeconomic areas (1.0 per 100,000).
Table 6.6: Unintentional poisoning deaths involving other substances, by socioeconomic area, 2016–17
|
Indicator |
Socioeconomic area | ||||
|---|---|---|---|---|---|
|
1—lowest |
2 | 3 | 4 | 5-highest | |
|
Number |
93 |
79 |
73 |
72 |
48 |
| % | 24.9 | 21.2 | 19.6 | 19.3 | 12.9 |
| Age-standardised rate (deaths per 100,000 population) | 2.0 | 1.6 | 1.5 | 1.5 | 1.0 |
Note: Excludes 5 deaths where socioeconomic area was not reported.
Source: AIHW NMD.
Aboriginal and Torres Strait Islander people
The age-standardised rate of unintentional poisoning deaths involving other substances for Aboriginal and Torres Strait Islander people was 4.4 times the rate for non-Indigenous Australians (Table 6.7).
Table 6.7: Key indicators for unintentional poisoning deaths involving other substances, by Indigenous status and sex, 2016–17
|
Indicator |
Indigenous | Non-Indigenous | ||||
|---|---|---|---|---|---|---|
| Males | Females | Persons | Males | Females | Persons | |
| Number |
20 |
11 |
31 |
167 |
60 |
227 |
| Age-standardised rate (deaths per 100,000 population) | 8.1 | 4.4 | 6.2 | 2.1 | 0.7 | 1.4 |
| Rate ratio(a) | 3.9 | 6.3 | 4.4 | . . | . . | . . |
| Rate difference(b) | 6.0 | 3.7 | 4.8 | . . | . . | . . |
Notes:
- Rate ratios are standardised rates for Indigenous males, females, and persons divided by standardised rates for non-Indigenous males, females, and persons.
- Rate differences are standardised rates for Indigenous males, females, and persons minus standardised rates for non-Indigenous males, females, and persons.
Note: Includes data for New South Wales, Queensland, Western Australia, South Australia, and the Northern Territory (see Box 1.2).
Source: AIHW NMD.
Types of substances
In 2016–17, more than 88% (328) of the unintentional poisoning deaths involving other substances involved the Toxic effect of alcohol (244 males; 84 females), with more than 81% (267) of those being among people aged 30–59.
Almost 6% (22) of deaths involved the Toxic effect of other gases, fumes and vapours (16 males; 6 females), and more than 4% (12 males; 4 females) involved the Toxic effect of carbon monoxide.
How have unintentional poisoning deaths involving other substances changed over time?
Age-standardised rates of unintentional poisoning deaths involving other substances fluctuated between 1999–00 and 2016–17, ranging from 1.3 deaths per 100,000 population in 2005–06 to 2.0 deaths per 100,000 in 1999–00 and 2014–15 (Figure 6.1).
Age and sex
While rates were generally higher towards the latter part of the period, there was no significant change in rates for either males or females. Between 1999–00 and 2016–17, rates were consistently 2.5–3.5 times as high for males as for females.
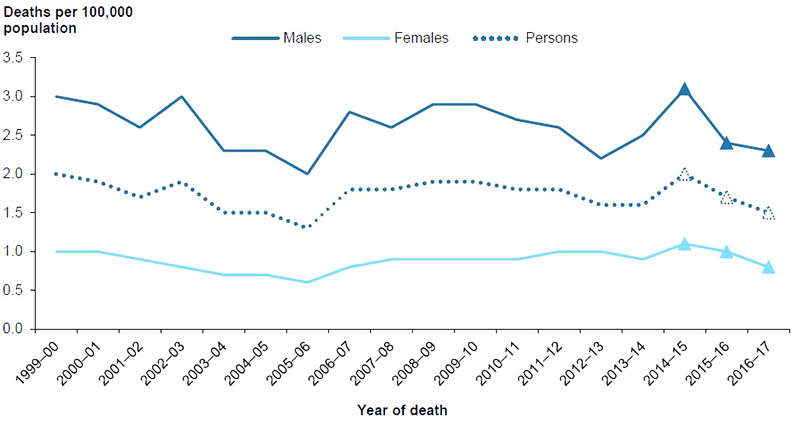
Notes:
- Values for the latest 3 years, shown as triangles, are subject to change due to later revisions of cause-of-death data by the ABS (see Appendix A for more information).
- Data underpinning this figure is available in the supplementary table spreadsheet Table SF6.1.
Source: AIHW NMD.
Figure 6.2 shows changes in rates of unintentional poisoning deaths involving other substances between 1999–00 and 2016–17 in each age group by sex.
Age-standardised rates for males were much higher than rates for females across all age groups, for nearly all years. Rates for males aged 15–24 and 25–44 followed a similar pattern, showing an overall decline in rates marked by significant fluctuation.
Rates for men aged 45–64 trended upwards overall, while rates for men aged 65 and over showed marked peaks in 2002–03 and 2014–15 without any overall trend.
Rates for women 25–44 and 65 and over remained relatively steady, despite some fluctuation, while there was a moderate upward trend for women aged 45–64.
Rates for females aged 15–24 and for both sexes at younger ages are not shown, due to small numbers.
Figure 6.2: Age-specific rates of unintentional poisoning deaths involving other substances, by age and sex, 1999–00 to 2016–17
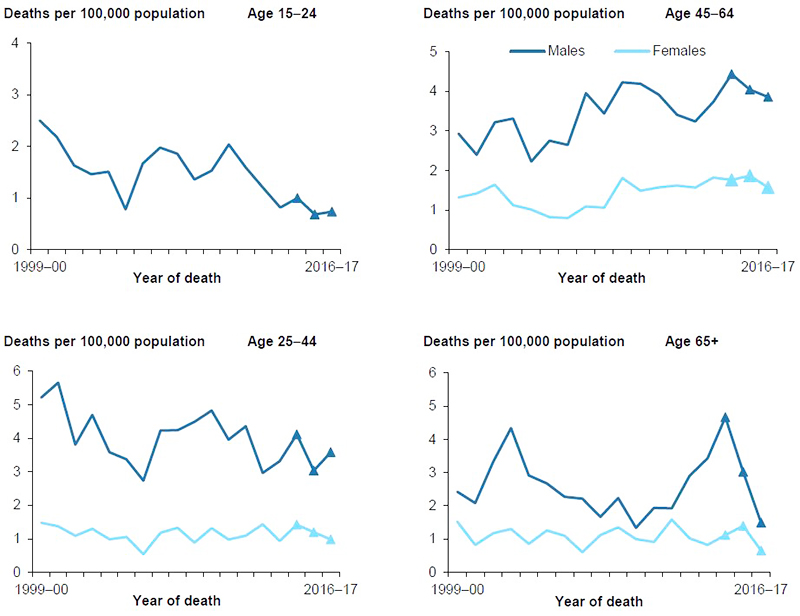
Notes:
- Values for the latest 3 years, shown as triangles, are subject to change due to later revisions of cause-of-death data by the ABS (see Appendix A for more information).
- Data underpinning this figure are available in the supplementary table spreadsheet Table SF6.2.
- Rates for children aged 0–4 and 5–14 and for females aged 15–24 are not shown, due to small numbers.
Source: AIHW NMD.
Remoteness of usual residence
Between 2001–02 and 2016–17, rates of unintentional poisoning deaths involving other substances were generally higher for residents of Remote and Very remote areas than for residents of other remoteness areas (Figure 6.3). Rates for residents of the 3 least remote areas were generally similar, and relatively steady over the period.
Rates for residents of Very remote areas were 2–7 times as high as rates for residents of Major cities. The fluctuation in rates in Very remote areas—and to some degree in the Remote areas—is partly a reflection of the small population and number of deaths occurring each year.
In 2009–10, the only year for which both ASGC-based and ASGS-based rates are shown, ASGS-based rates were higher than ASGC-based rates in Very remote areas.
See Appendix A for more information of the ASGC and ASGS classification systems.
Figure 6.3: Age-standardised rates of unintentional poisoning deaths involving other substances, by remoteness of usual residence, 2001–02 to 2016–17
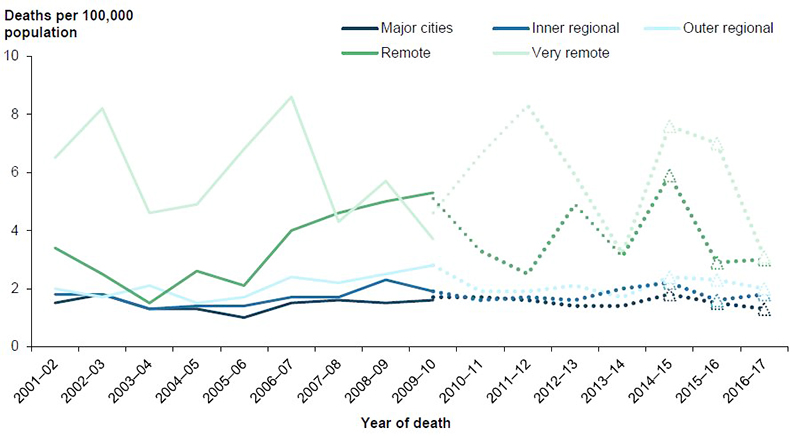
Notes:
- Data for 1999−00 and 2000–01 were unavailable.
- Full lines are ASGC-based, while dotted lines are ASGS-based.
- Values for the latest 3 years, shown as triangles, are subject to change due to later revisions of cause-of-death data by the ABS (see Appendix A for more information).
- Data underpinning this figure are available in the supplementary table spreadsheet Table SF6.3.
Source: AIHW NMD.
Aboriginal and Torres Strait Islander people
Age-standardised rates of unintentional poisoning deaths involving other substances for Aboriginal and Torres Strait Islander people fluctuated markedly from year to year between 2001–02 and 2016–17 (Figure 6.4). By contrast, rates for non-Indigenous Australians remained relatively steady over the same period, partly reflecting the larger numbers of cases.
Rates for Aboriginal and Torres Strait Islander people were consistently 3–6 times as high as rates for non-Indigenous Australians over most of the period.
Figure 6.4: Age-standardised rates of unintentional poisoning deaths involving other substances, by Indigenous status, 2001–02 to 2016–17
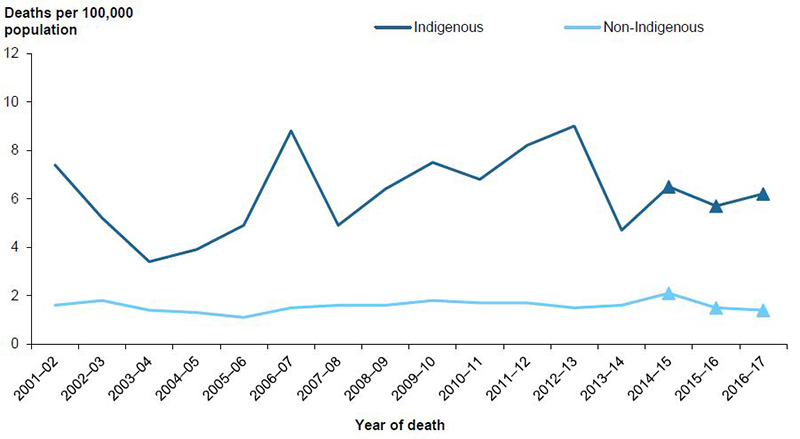
Notes:
- Data are for New South Wales, Queensland, Western Australia, South Australia, and the Northern Territory, the 5 jurisdictions for which recording of Indigenous status was considered to be of adequate quality throughout the study period.
- Values for the latest 3 years, shown as triangles, are subject to change due to later revisions of cause-of-death data by the ABS (see Appendix A for more information).
- Data underpinning this figure are available in the supplementary table spreadsheet Table SF6.4.
Source: AIHW NMD.