
Thermal injury
The focus of this section is injury deaths related to Exposure to smoke, fire and flames or Contact with heat and hot substances. For brevity, the injuries resulting from these types of exposures are referred to in this report as ‘thermal injuries’.
The section provides:
- a summary of all thermal injury deaths in 2016–17 that are identifiable in the deaths data
- a statistical summary of unintentional thermal injury deaths in that year
- a description of trends in unintentional thermal injury deaths from 1999–00 to 2016–17.
What methods were used?
The criteria given in Section 1.3 were applied, and the records that included the following ICD-10 codes were included in this section:
- the UCoD was Exposure to smoke, fire and flames or Contact with heat and hot substances (X00–X19)
- the MCoDs included codes for Exposure to smoke, fire and flames or Contact with heat and hot substances (X00–X19) and for Injury (S00–T75 or T79)
- the MCoDs included codes for Burns (T20–T31) and for External causes of unintentional injury (V01–X59).
Suicide and homicide deaths (UCoD X60–Y09) were excluded. The concepts underlying the abbreviations used in this section are defined in the Glossary.
Relevant terms and information about the data used in this section are summarised in boxes 1.1, 1.2 and 8.1. Further information on methods is provided in Appendix A.
Box 8.1: External causes of injury due to exposure to smoke, fire, heat, and hot substances injury
The sections of Chapter XX External causes of morbidity and mortality of ICD-10 about unintentional Exposure to smoke, fire and flames (X00–X09) and unintentional Contact with heat and hot substances (X10–X19) include:
- Exposure to smoke, fire and flames (X00–X09)
- Exposure to uncontrolled fire in building or structure (X00)
- Exposure to uncontrolled fire, not in building or structure (X01)
- Exposure to controlled fire in building or structure (X02)
- Exposure to controlled fire, not in building or structure (X03)
- Exposure to ignition of highly flammable material (X04)
- Exposure to ignition or melting of nightwear (X05)
- Exposure to ignition or melting of other clothing and apparel (X06)
- Exposure to other specified smoke, fire and flames (X07)
- Exposure to unspecified smoke, fire and flames (X09)
- Contact with heat and hot substances (X10–X19)
- Contact with hot drinks, food, fats and cooking oils (X10)
- Contact with hot tap-water (X11)
- Contact with other hot fluids (X12)
- Contact with steam and hot vapours (X13)
- Contact with hot air and gases (X14)
- Contact with hot household appliances (X15)
- Contact with hot heating appliances, radiators and pipes (X16)
- Contact with hot engines, machinery and tools (X17)
- Contact with other hot metals (X18)
- Contact with other and unspecified heat and hot substances (X19).
How many deaths in 2016–17 were due to unintentional thermal injury?
Unintentional thermal injuries accounted for 101 injury deaths, 0.8% of all injury deaths (Table 8.1). More than twice as many males as females were fatally injured due to this type of injury in 2016–17.
Table 8.1: Key indicators for unintentional thermal injury deaths, by sex, 2016–17
|
Indicator |
Males | Females | Persons |
|---|---|---|---|
|
Number |
70 |
31 |
101 |
| Percentage of all injury deaths | 0.9 | 0.6 | 0.8 |
| Crude rate (deaths per 100,000 population) | 0.6 | 0.3 | 0.4 |
| Age-standardised rate (deaths per 100,000 population) | 0.6 | 0.2 | 0.4 |
Source: AIHW NMD.
People aged 65 and over accounted for almost 41% of all unintentional thermal injury deaths (Table 8.2).
The proportion of male deaths was higher than female deaths in people aged 25–44 and 45–64, while the opposite occurred for those aged 65 and over. These results should be treated with caution due to the relatively low number of deaths involved.
Table 8.2: Unintentional thermal injury deaths, by age and sex, 2016–17
|
Age group |
Males |
Females | Persons | |||
|---|---|---|---|---|---|---|
| Number | % | Number | % | Number | % | |
|
0–4 |
1 |
1.4 |
0 |
0.0 |
1 |
1.0 |
| 5–14 | 0 | 0.0 | 3 | 9.7 | 3 | 3.0 |
| 15–24 | 7 | 10.0 | 4 | 12.9 | 11 | 10.9 |
| 25–44 | 18 | 25.7 | 4 | 12.9 | 22 | 21.8 |
| 45–64 | 17 | 24.3 | 6 | 19.4 | 23 | 22.8 |
| 65+ | 27 | 38.6 | 14 | 45.2 | 41 | 40.6 |
| Total | 70 | 100.0 | 31 | 100.0 | 101 | 100.0 |
Source: AIHW NMD.
State or territory of usual residence
Age-standardised rates for unintentional thermal injury deaths for residents of Tasmania (1.7 deaths per 100,000 population) and the Northern Territory (1.4 deaths per 100,000) were, respectively, 4.3 times and 3.5 times as high as the national rate (0.4 deaths per 100,000) (Table 8.3). These results should be treated with caution, as even small variation in the case numbers in these jurisdictions can lead to proportionately large variability in rates from year to year. The more populous jurisdictions recorded rates similar to the national rate.
Table 8.3: Unintentional thermal injury deaths, by state/territory of usual residence, 2016–17
|
Indicator |
State/territory of usual residence | |||||||
|---|---|---|---|---|---|---|---|---|
| NSW | VIC | QLD | WA | SA | TAS | ACT | NT | |
|
Number |
35 |
20 | 14 | 10 | 8 | 10 | 0 | 4 |
|
% |
34.7 |
19.8 | 13.9 | 9.9 | 7.9 | 9.9 | 0.0 | 4.0 |
|
Age-standardised rate |
0.4 |
0.3 | 0.3 | 0.4 | 0.4 | 1.7 | 0.0 | 1.4 |
Source: AIHW NMD.
Remoteness of usual residence
Age-standardised rates for unintentional thermal injury were higher in Inner regional and Outer regional areas than in Major cities (Table 8.4). Rates for the 2 most remote areas are difficult to interpret, because they are sensitive to even small variation in the case numbers.
Table 8.4: Unintentional thermal injury deaths, by remoteness of usual residence, 2016–17
|
Indicators |
Remoteness of usual residence(b) | ||||
|---|---|---|---|---|---|
|
Major cities |
Inner regional | Outer regional | Remote | Very remote | |
|
Number(a) |
45 |
27 |
24 |
2 |
2 |
| % | 45.3 | 26.8 | 24.0 | 2.0 | 1.9 |
| Age-standardised rate (deaths per 100,000 population) | 0.3 | 0.5 | 1.2 | 0.8 | 1.6 |
Notes:
- Excludes 1 death where remoteness was not reported.
- Derived using the ASGS classification.
Source: AIHW NMD.
Socioeconomic area
The age-standardised death rates for unintentional thermal injury were similar for residents of the 3 lowest socioeconomic areas (Table 8.5). These rates were 1.7 times the rate for residents of the second highest socioeconomic areas, and 5 times the rate for residents of the highest. Comparison of rates between socioeconomic areas should be treated with caution due to the relatively small numbers of deaths involved.
Table 8.5: Unintentional thermal injury deaths, by socioeconomic area, 2016–17
|
Indicator |
Socioeconomic area | ||||
|---|---|---|---|---|---|
|
1—lowest |
2 | 3 | 4 | 5-highest | |
|
Number |
24 |
27 |
26 |
16 |
7 |
| % | 23.8 | 26.7 | 25.7 | 15.8 | 6.9 |
| Age-standardised rate (deaths per 100,000 population) | 0.5 | 0.5 | 0.5 | 0.3 | 0.1 |
Note: Excludes 1 death where socioeconomic area was not reported.
Source: AIHW NMD.
How have unintentional thermal injury deaths changed over time?
Between 1999–00 and 2016–17, age-standardised rates of unintentional thermal injury deaths fluctuated, but fell over time, with the exception of a spike in 2008–09 as a result of the 2009 Victorian bushfires (Figure 8.1).
Age and sex
Despite some fluctuations, patterns in rates for males and females were similar. Rates for males were consistently 1.5–3 times as high as female rates.
Figure 8.1: Age-standardised rates of unintentional thermal injury deaths, by sex, 1999–00 to 2016–17
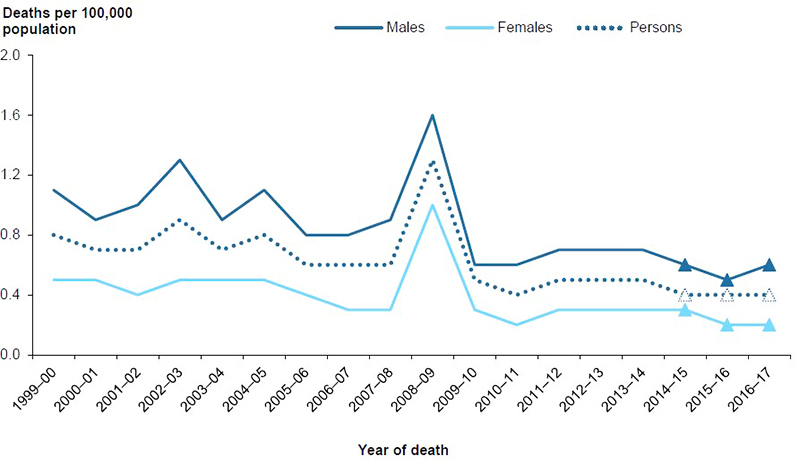
Notes:
- Values for the latest 3 years, shown as triangles, are subject to change due to later revisions of cause-of-death data by the ABS (see Appendix A for more information).
- Data underpinning this figure are available in the supplementary table spreadsheet Table SF8.1.
Source: AIHW NMD.
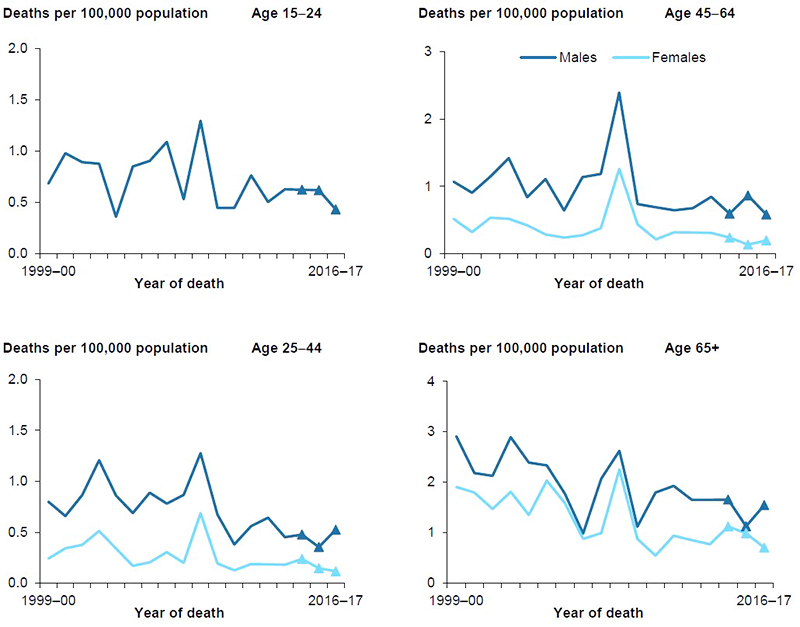
Figure 8.2 shows changes in thermal injury death rates between 1999–00 and 2016–17 in each age group by sex.
Age-specific rates for males were higher than female rates for all ages and in all years. The peak in rates in 2008–09—due to the 2009 Victorian bushfires—was most prominent in those aged 45–64. The difference in rates between males and females was most marked at ages 25–44.
Rates declined over time for both males and females in all 4 of the age groups shown, with the most marked downward trend among those aged 65 and over.
Rates for children aged 0–14 and women aged 15–24 are not shown, due to small numbers.
Figure 8.2: Age-specific rates of unintentional thermal injury deaths, by age and sex, 1999–00 to 2016–17
Notes:
- Values for the latest 3 years, shown as triangles, are subject to change due to later revisions of cause-of-death data by the ABS (see Appendix A for more information).
- Data underpinning this figure are available in the supplementary table spreadsheet Table SF8.2.
- Rates for children aged 0–4 and 5–14 and for females aged 15–24 are not shown, due to small numbers.
Source: AIHW NMD.
Remoteness of usual residence
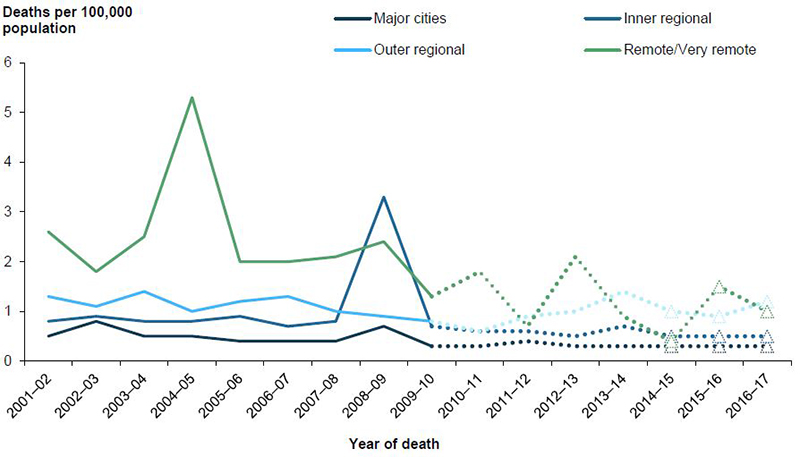
Between 2001–02 and 2016–17, rates of unintentional thermal injury deaths were consistently higher for residents of Remote and very remote areas than for residents of all other remoteness areas (Figure 8.3). Notably, in 2016–17, the rates for all remoteness areas were similar.
The fluctuation in rate of injury deaths in the Remote and very remote areas is partly a reflection of the small population and number of incidents occurring each year. But it also reflects the pattern of deaths due to bushfires, with the number varying greatly between years.
The peak in Remote and very remote areas in 2004–05 includes the deaths that occurred in the Eyre Peninsula fire in January 2005, while the peak in Inner regional areas in 2008–09 includes the deaths that occurred in the Victorian bushfires in February 2009.
Figure 8.3: Age-standardised rates of unintentional thermal injury deaths, by remoteness of usual residence, 2001–02 to 2016–17
Notes:
- Data for 1999-00 and 2000–01 were unavailable.
- The rates for Remote and Very remote areas are combined, due to small numbers.
- Full lines are ASGC-based, while dotted lines are ASGS-based.
- Values for the latest 3 years, shown as triangles, are subject to change due to later revisions of cause-of-death data by the ABS (see Appendix A for more information).
- Data underpinning this figure are available in the supplementary table spreadsheet Table SF8.3.
Source: AIHW NMD.