How have unintentional transport injury deaths changed over time?
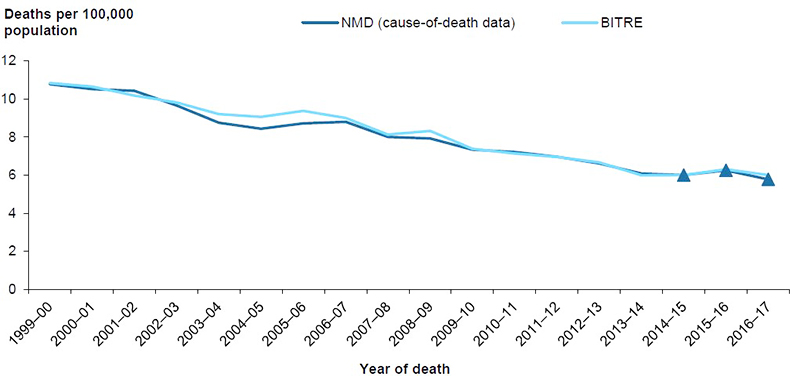
Crude rates of deaths from transport crashes decreased from 10.8 deaths per 100,000 population in 1999–00 to 5.8 in 2016–17, an average decrease of 3.7% per year (Figure 3.1). This decrease and the pattern of variation with time should be treated with caution, due to issues related to data processing during this period (see Appendix A).
Supplementary estimates, based on road death data from the Bureau of Infrastructure, Transport and Regional Economics (BITRE 2019), also show an average decrease of 3.7% per year during this period, with less fluctuation in the mid-2000s.
Crude rates were calculated for NMD data to allow better comparability with the BITRE estimates, and because there was little difference between crude and adjusted rates for the NMD data.
Figure 3.1: Crude rates of unintentional transport injury deaths, 1999–00 to 2016–17
Notes:
- Values for the latest 3 years of NMD-based rates, shown as triangles, are subject to change due to later revisions of cause-of-death data by the ABS (see Appendix A for more information).
- Data underpinning this figure are available in the supplementary table spreadsheet Table SF3.1.
- Estimate based on BITRE data is based on crude rates (see Appendix A for method).
Source: AIHW NMD; BITRE 2019.
Age and sex
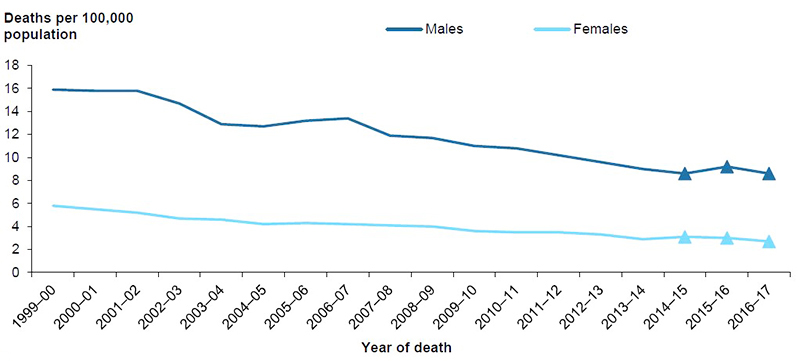
Between 1999–00 and 2016–17, age-standardised rates of transport-related injury deaths declined for both males and females (Figure 3.2). For males, rates fell by an average of 3.7% per year, while for females, rates fell by an average of 3.9% per year. Rates were consistently about 3 times as high for males as for females.
Figure 3.2: Age-standardised rates of unintentional transport injury deaths, by sex, 1999–00 to 2016–17
Notes:
- Values for the latest 3 years, shown as triangles, are subject to change due to later revisions of cause-of-death data by the ABS (see Appendix A for more information).
- Data underpinning this figure are available in the supplementary table spreadsheet Table SF3.2.
Source: AIHW NMD.
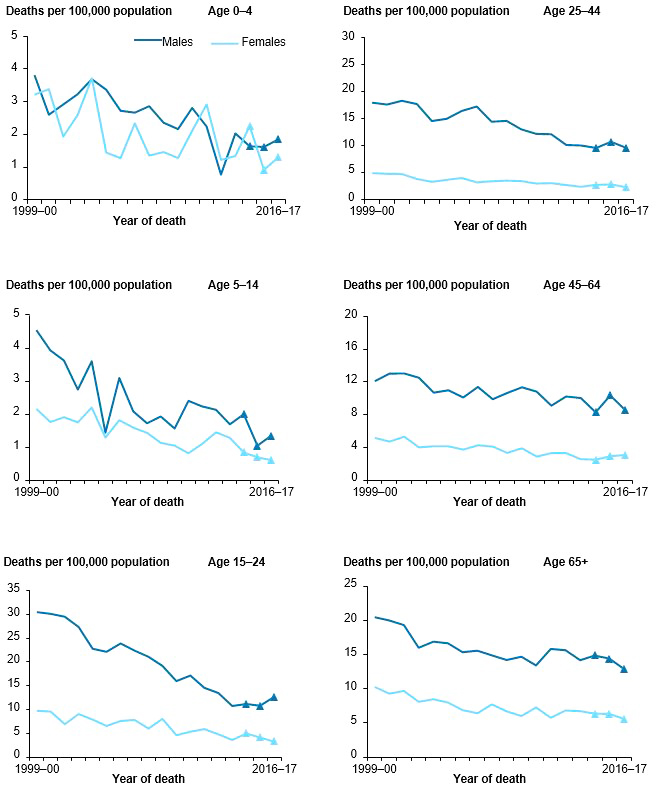
Figure 3.3 shows changes in rates of transport-related injury deaths between 1999–00 and 2016–17 in each age group by sex.
Age-specific rates for males were higher than for females across all age groups for all years, except for children aged 0–4, where rates were generally similar for both genders. The differences in rates between males and females was most marked in those aged 25–44, with rates for males being consistently more than 4 times as high as for females. Rates for all age groups declined over time (with fluctuations), for both males and females. The smallest decline occurred for those aged 45–64.
Figure 3.3: Age-specific rates of unintentional transport injury deaths, by age and sex, 1999–00 to 2016–17
Notes:
- Values for the latest 3 years, shown as triangles, are subject to change due to later revisions of cause-of-death data by the ABS (see Appendix A for more information).
- Data underpinning this figure are available in the supplementary table spreadsheet Table SF3.3.
Source: AIHW NMD.
Remoteness of usual residence
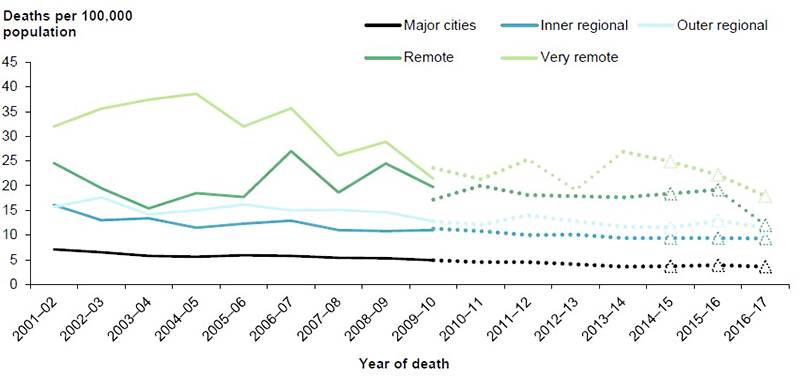
Rates of transport injury deaths were consistently higher over time for residents of Very remote areas, compared with residents of all other remoteness areas (Figure 3.4). Rates for residents of Very remote areas were consistently 5–7 times as high as rates for residents of Major cities. Rates for all 5 remoteness areas declined between 2000–01 and 2016–17.
The fluctuation in rates of injury deaths in Very remote and Remote areas partly reflects the small population and number of incidents occurring each year.
In 2009–10, the only year for which both ASGC-based and ASGS-based rates are shown, the ASGC-based rates were higher than the ASGS-based rates in Remote areas, while for Very remote areas, the ASGS-based rates were higher (see Appendix A for more information of the ASGC and ASGS classification systems).
Figure 3.4: Age-standardised rates of unintentional transport injury deaths, by remoteness of usual residence, 2001–02 to 2016–17
Notes:
- Data for 1999−00 and 2000–01 were unavailable.
- Full lines are ASGC-based, while dotted lines are ASGS-based.
- Values for the latest 3 years, shown as triangles, are subject to change due to later revisions of cause-of-death data by the ABS (see Appendix A for more information).
- Data underpinning this figure are available in the supplementary table spreadsheet Table SF3.4.
Source: AIHW NMD.
Aboriginal and Torres Strait Islander people
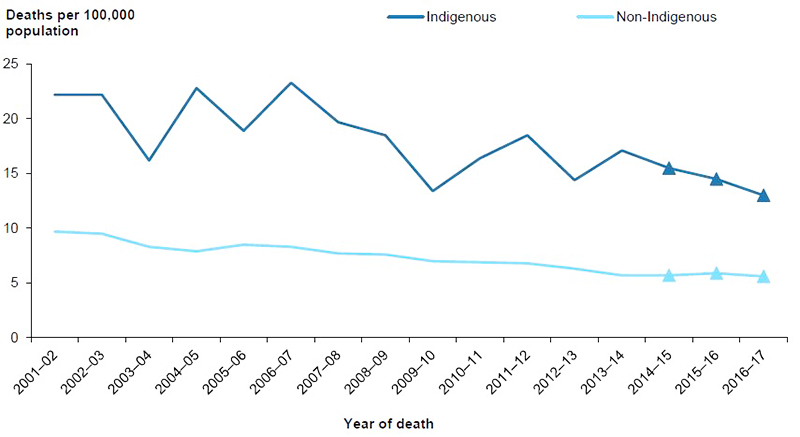
Age-standardised rates of transport-related injury deaths decreased over time for both Aboriginal and Torres Strait Islander people and for non-Indigenous Australians (Figure 3.5).
Between 1999–00 and 2016–17, rates fell by an average of 3.2% per year for Aboriginal and Torres Strait Islander people, and by an average of 3.5% per year for non-Indigenous Australians. Rates were consistently about 2–3 times as high for Indigenous Australians as for non-Indigenous Australians.
Figure 3.5: Age-standardised rates of unintentional transport injury deaths, by Indigenous status, 2001–02 to 2016–17
Notes:
- Data are for New South Wales, Queensland, Western Australia, South Australia, and the Northern Territory, the 5 jurisdictions for which recording of Indigenous status was considered to be of adequate quality throughout the study period.
- Values for the latest 3 years, shown as triangles, are subject to change due to later revisions of cause-of-death data by the ABS (see Appendix A for more information).
- Data underpinning this figure are available in the supplementary table spreadsheet Table SF3.5.
Source: AIHW NMD.