Maternal deaths
Content warning: This page contains information some readers may find distressing as it relates to maternal deaths, suicide and self-harm, alcohol and drug use, and pregnancy loss.
On this page:
Maternal deaths in Australia
In Australia, where childbirth is safe for most women, maternal death is rare. In 2023, 27 women were reported to have died during pregnancy or within 42 days of the end of pregnancy. Of these, 23 were classified as directly or indirectly related to the pregnancy, 3 were coincidental and one death has not yet been classified (definitions for these terms are provided below).
Data about the deaths that were directly or indirectly related to pregnancy are the focus of this report.
In 2023:
- The maternal mortality ratio (MMR) in Australia was 8.2 deaths per 100,000 women giving birth (23 maternal deaths). Australia’s MMR trend (since the early 1970s) is presented in Maternal mortality over time.
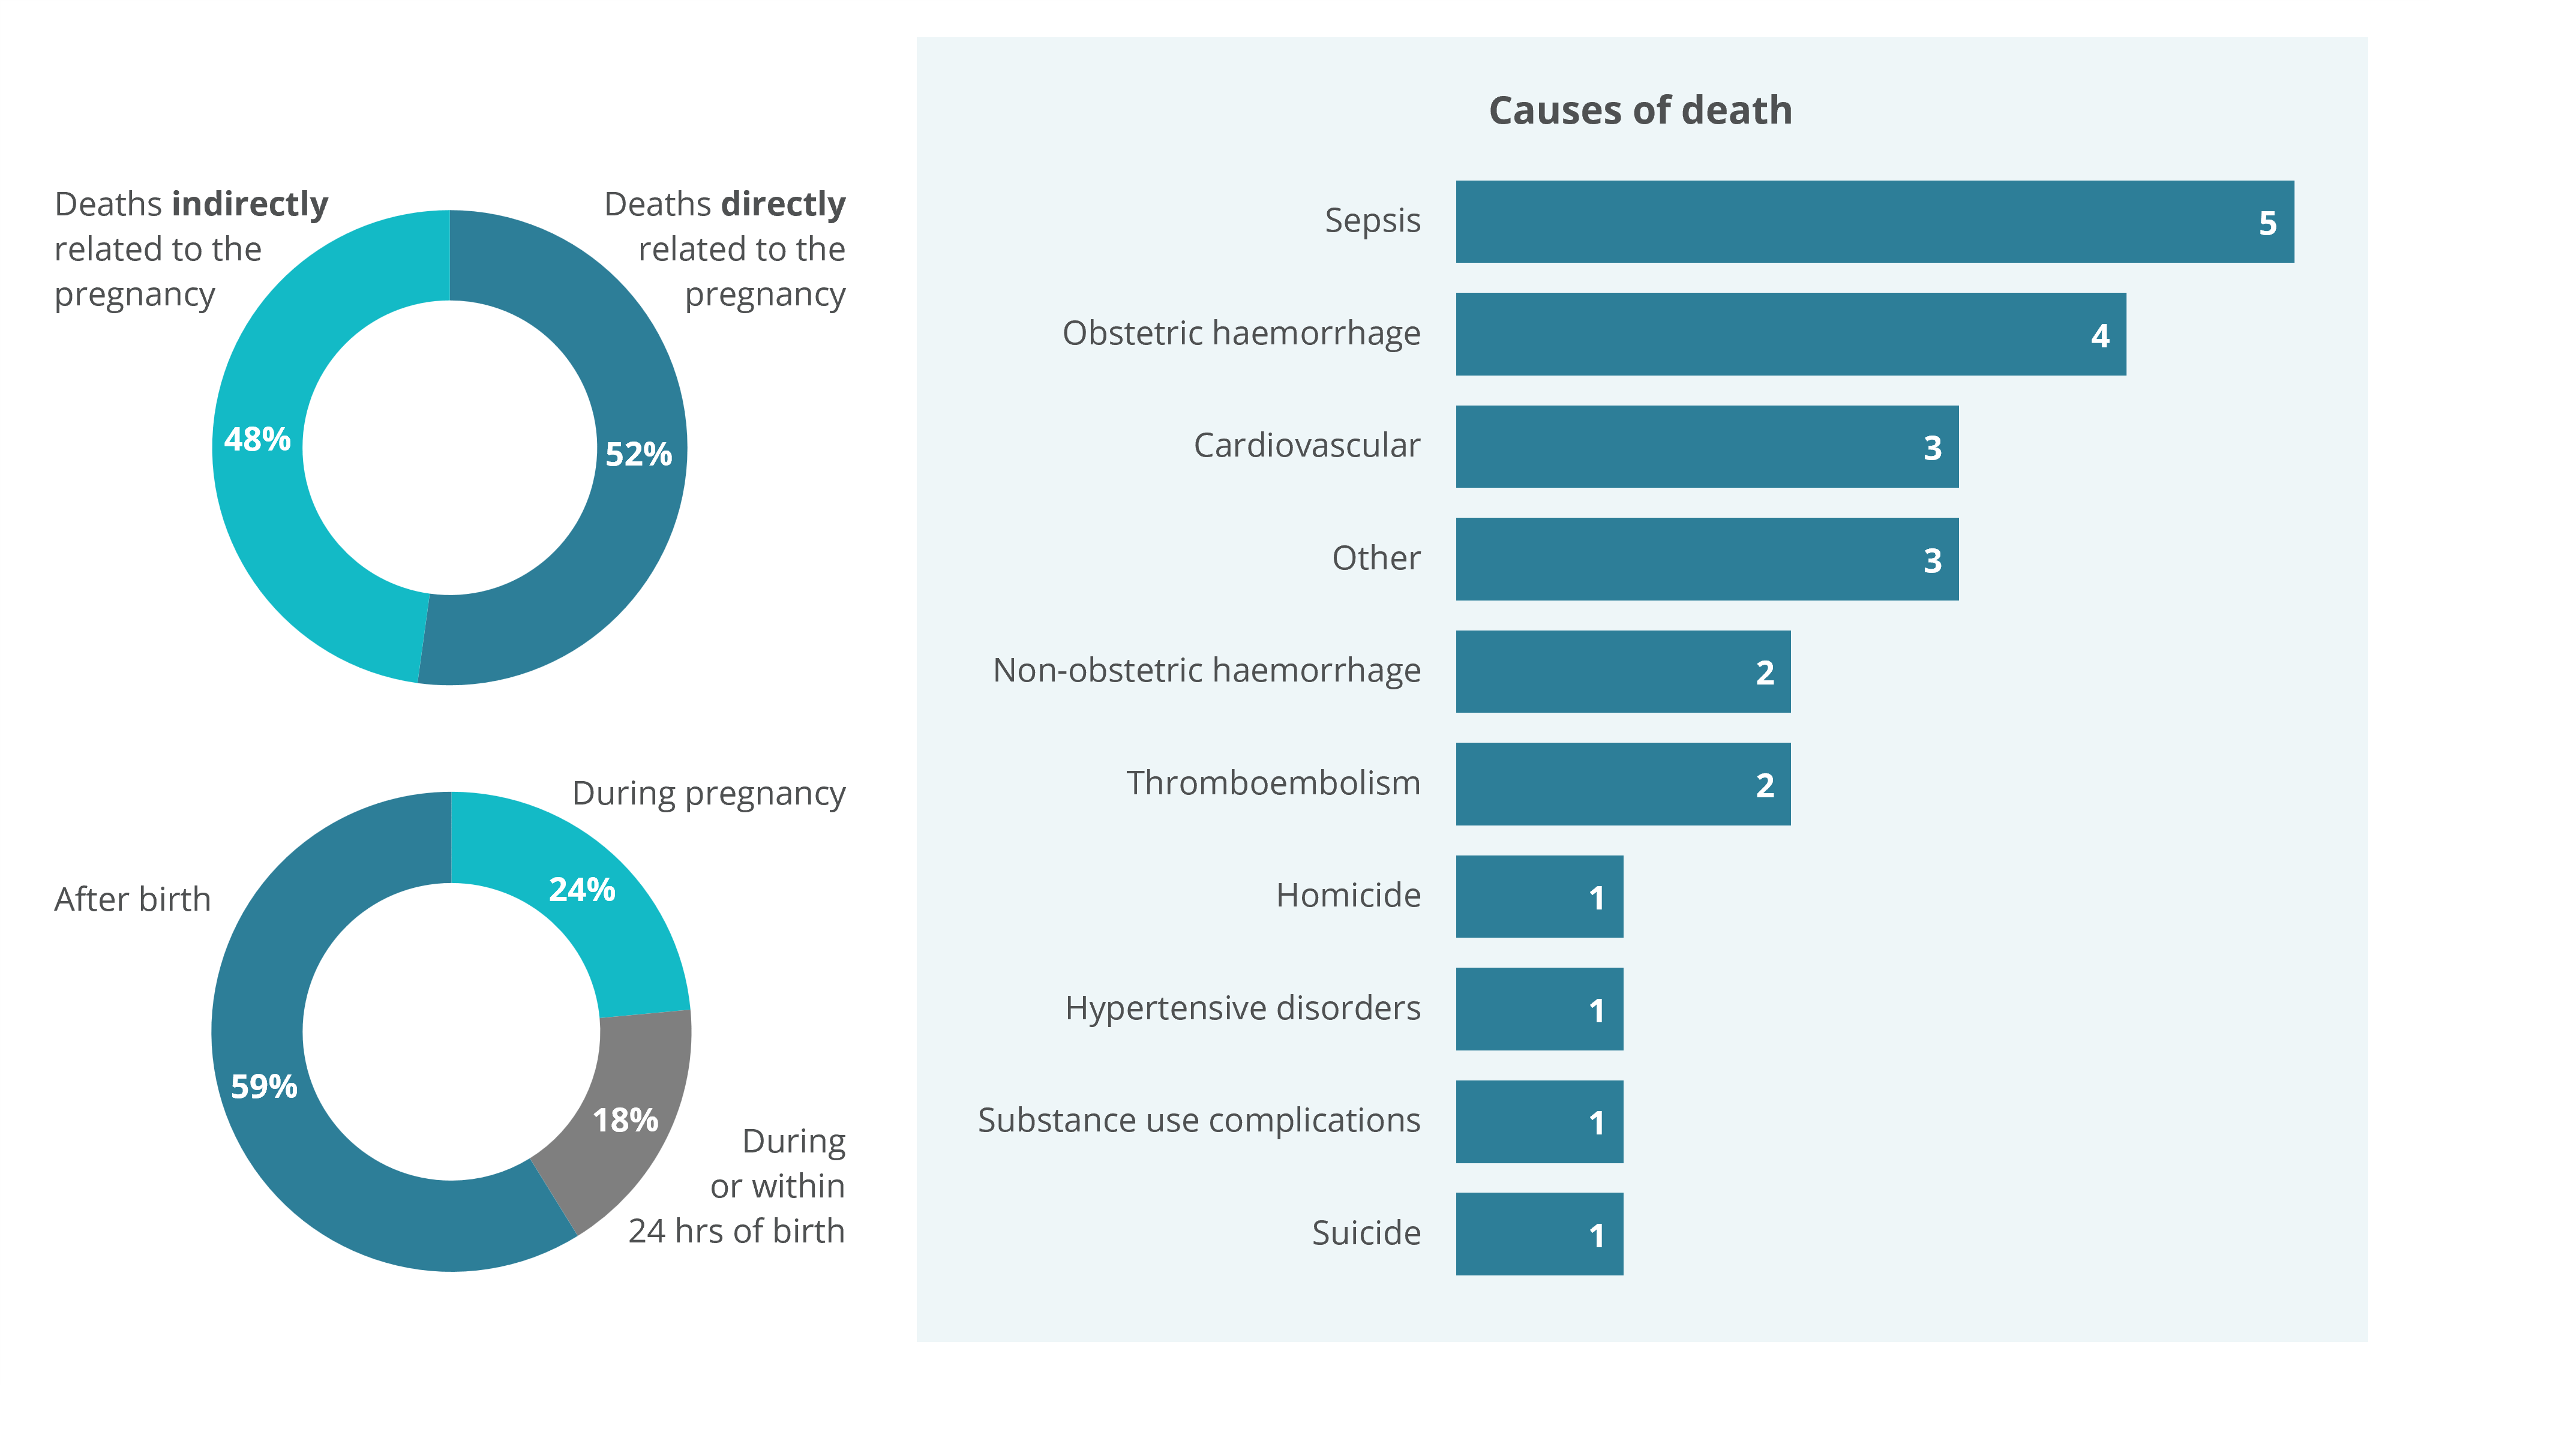
- Of the 23 maternal deaths, 52% were directly related to pregnancy, while 48% were indirectly related (Figure 1).
- Nearly two thirds (59%) of maternal deaths occurred after birth, while 18% occurred during or within 24 hours of birth, and 24% occurred during pregnancy (Figure 1).
Figure 1: Maternal deaths in Australia, 2023

1. One death from 2023 has not yet been classified as either a maternal death or coincidental and is therefore not included in this report. The classification will be updated once the jurisdictional maternal mortality review committee has reviewed the death.
2. Data may not add to the total due to rounding.
Source: AIHW analysis of the National Maternal Mortality Data Collection.
Definitions
All deaths that occur during pregnancy or within 42 days of the end of a pregnancy are reviewed by health professionals to determine the likely cause and whether the pregnancy contributed to the death. Following review, deaths are classified as maternal (direct, indirect or not further classified) coincidental, or unclassified.
Maternal deaths
Maternal death is the death of a woman while pregnant or within 42 days of the end of pregnancy, irrespective of the duration and outcome of the pregnancy, from any cause related to or aggravated by the pregnancy or the associated care received but not from accidental or incidental causes. Maternal deaths are divided into 2 categories:
- Direct maternal deaths are those resulting from complications of pregnancy or birth and/or the associated clinical care; and
- Indirect maternal deaths are those resulting from diseases or conditions that were not due to a direct obstetric cause, but were aggravated by the pregnancy or birth.
Coincidental deaths
Coincidental deaths are defined as those that are reported to have occurred during pregnancy or within 42 days of the end of pregnancy, but are considered to be causally unrelated to pregnancy. Unlike direct and indirect maternal deaths, coincidental deaths are excluded from analysis and maternal mortality ratio (MMR) calculations.
There were 45 coincidental deaths in Australia from 2014–2023. The most common causes of these deaths were motor vehicle trauma and cancer. Although not the focus of this report, some additional data on these deaths, such as causes, can be found in Tables 1 & 2 of the supplementary tables (Data tables: National Maternal Mortality Data Collection annual update 2023).
Maternal mortality ratio
The incidence of maternal death is expressed as the maternal mortality ratio (MMR). The MMR is calculated using direct, indirect and not classified maternal deaths and expressed as per 100,000 women giving birth. Coincidental deaths and deaths awaiting classification are not included in MMR calculations.
Maternal mortality over time
Due to the small number of maternal deaths that occur in a year, small variations in the number can lead to large fluctuations in the MMR making it difficult to interpret the trend in maternal mortality over time using single year rates. Using a ‘triennia’ approach (aggregating three years of data) can assist. Over the past 50 years, the rate has fluctuated at times but overall Australia’s MMR has significantly declined from 12.7 per 100,000 women giving birth in 1973–1975, to 6.7 in 2021–2023.
Prior to the most recent period, the rate of maternal death had decreased in each of the preceding 4 triennia, from 7.7 in 2009–2011 to 6.3 in 2018–2020. However, this triennium (2021–2023) shows an increase in the MMR, to 6.7 per 100,000 women giving birth. The MMR will be monitored as more data are available.
Internationally, Australia has one of the lowest MMRs. Compared with other countries that are signatories to the United Nations’ Sustainable Development Goals (SDGs), Australia and New Zealand had the lowest MMR across the SDG regions in 2023 (WHO, 2025). For more information on Australia’s MMR in an international context see: Maternal Deaths in Australia 2018–2020.
Data on maternal mortality ratios over time can be explored in the interactive data visualisation below, with data also presented in Table 1 of the supplementary data tables (Data tables: National Maternal Mortality Data Collection annual update 2023).
Figure 2: Maternal mortality ratio of women who gave birth, 1973–1975 to 2021–2023
The maternal mortality ratio has declined considerably over the past 50 years, from 12.7 per 100,000 in 1973–1975 to 6.7 per 100,000 in 2021–2023
| Year | Direct | Indirect | Total |
|---|---|---|---|
| 1973–1975 | 8.3 | 4.4 | 12.7 |
| 1976–1978 | 7.7 | 5.2 | 12.8 |
| 1979–1981 | 7.9 | 5 | 12.9 |
| 1982–1984 | 5.9 | 3.5 | 9.4 |
| 1985–1987 | 4.4 | 4.1 | 8.5 |
| 1988–1990 | 4.9 | 4.4 | 9.3 |
| 1991–1993 | 3.5 | 2.9 | 6.2 |
| 1994–1996 | 6 | 2.6 | 8.6 |
| 1997–1999 | 4.5 | 4 | 8.4 |
| 2000–2002 | 4.2 | 6.9 | 11.1 |
| 2003–2005 | 3.8 | 4.7 | 8.4 |
| 2006–2008 | 2.7 | 4 | 6.9 |
| 2009–2011 | 3 | 4.3 | 7.7 |
| 2012–2014 | 3.7 | 3.5 | 7.2 |
| 2015–2017 | 2.5 | 4 | 6.6 |
| 2018–2020 | 3.5 | 2.8 | 6.3 |
| 2021–2023 | 2.8 | 3.8 | 6.7 |
- For periods prior to 2009, data are sourced from historical reports as published in Maternal deaths in Australia 2018–2020. For 2009 onwards, data are based on the latest data from the National Maternal Mortality Data Collection. As minor revisions occur to the data over time, results here may differ slightly from those published previously.
- In 2025, the classification of some historical deaths due to psychosocial causes were revised (see technical notes). As a result, maternal death rates over the period 2009-2022 differ in this report compared with previous AIHW reporting.
- Total maternal deaths include direct, indirect and maternal deaths not further classified.
- The denominator for the MMR is calculated using the number of women who gave birth to at least 1 baby (either a live birth or a stillbirth) of 20 or more weeks' completed gestation or with a birthweight of 400 grams or more. Minor revisions to the National Perinatal Data Collection may occur over time. The data presented are based on the latest available data at the time of publication and may differ slightly from those published in previous releases.
Source:
AIHW analysis of the National Maternal Mortality Data Collection and the National Perinatal Data Collection
|
Data source overview
Maternal deaths 2014–2023 (combined)
Maternal deaths in Australia are rare, therefore, data are aggregated over a ten-year period to allow more detailed and meaningful analyses of small numbers. In the following sections of this report, data on maternal deaths from 2014 to 2023 are presented.
In the decade from 2014 to 2023, there were 197 maternal deaths and a maternal mortality ratio of 6.6 deaths per 100,000 women giving birth.
Causes of maternal deaths
The most frequent causes of maternal death reported in Australia between 2014 and 2023 were:
- For all maternal deaths:
- cardiovascular disease (27 deaths or 14%)
- sepsis (24 deaths or 12%)
- suicide (20 deaths or 10%)
- thromboembolism (obstruction of a blood vessel by a blood clot) (19 deaths or 10%)
- For direct maternal deaths:
- thromboembolism (obstruction of a blood vessel by a blood clot) (18 deaths)
- amniotic fluid embolism (significant amounts of amniotic fluid entering the maternal circulation) (17 deaths)
- sepsis (14 deaths)
- For indirect maternal deaths:
- complications of pre-existing cardiovascular disease (24 deaths)
- substance use complications (15 deaths)
- non-obstetric haemorrhage (mostly haemorrhage within the brain and haemorrhage from a ruptured aneurysm of the splenic artery) (13 deaths)
Data on causes of maternal deaths from 2014–2023 can be explored in the interactive visualisation below, with data also presented in Table 2 of the supplementary data tables (Data tables: National Maternal Mortality Data Collection annual update 2023).
Figure 3: Number of maternal deaths, by cause of death, 2014–2023
For the period 2014 to 2023 cardiovascular disease was the leading cause of maternal death, with 27 deaths.
Timing of maternal deaths
Understanding the timing of maternal deaths is important for identifying periods of critical risk. Between 2014 and 2023:
- Almost 2 in 5 (37%) maternal deaths occurred in women who were pregnant at the time of their death. Of these women, almost 2 in 5 (35%) died during the first trimester of pregnancy (less than 14 weeks of pregnancy).
- Almost 1 in 5 (18%) maternal deaths occurred during the birth process or within 24 hours of giving birth.
- More than 2 in 5 (45%) maternal deaths occurred after the woman gave birth, with more than half (58%) of these deaths occurring within 1 to 13 days of giving birth.
These proportions do not include maternal deaths following or due to miscarriage or termination of pregnancy as the timing of death is not routinely reported for these cases.
Data on the timing of maternal deaths between 2014 and 2023 can be explored in the interactive visualisation below, with data also presented in Table 3 of the supplementary data tables (Data tables: National Maternal Mortality Data Collection annual update 2023).
Figure 4: Number of maternal deaths, by timing of death, 2014–2023
For the period 2014 to 2023, 73 deaths occurred after birth
Characteristics of women who died
This section presents some demographic characteristics of the women who died from 2014–2023. It should be noted that not all demographic information was available for all women who died. Caution should be used when interpreting these data, due to the small number of maternal deaths in Australia, and even smaller numbers when these deaths are broken down by characteristics. To address this, data are aggregated over a decade.
Maternal age
Women aged under 20 had the highest MMR, followed by those aged 40 or more (19.2 and 14.8 per 100,000 women giving birth, respectively). The lowest MMR was for women in the 20 to 24 age group, followed by women in the 25 to 29 age group (3.3 and 4.5 per 100,000 women giving birth, respectively).
Maternal Indigenous status
In the period 2014–2023, there were 27 maternal deaths among Aboriginal and Torres Strait Islander (First Nations) women, and the MMR for First Nations women was 19.0 per 100,000 women giving birth. In the same period (2014–2023), the MMR for non-Indigenous women was 5.5 per 100,000 women giving birth.
Parity
Parity refers to a woman’s number of previous pregnancies, excluding the current pregnancy, carried to a viable gestational age (usually 20 weeks). The rate of maternal death broadly increased with parity, from an MMR of 5.1 and 4.0 per 100,000 women giving birth for women with a parity of 0 and 1 respectively, increasing up to 11.2 for women with a parity of 3 and 25.5 for women with a parity of 4 or more.
Smoking status
The rate of maternal death was higher in women who reported smoking during the first 20 weeks of pregnancy than in women who reported that they did not smoke during the first 20 weeks of pregnancy (16.6 compared to 4.1 per 100,000 women giving birth). As the number of maternal deaths with an unknown smoking status is relatively high (28% of data from included jurisdictions), caution should be used when interpreting these data.
Remoteness
Women who lived in Remote and very remote areas had the highest rate of maternal death, followed by women who lived in Inner regional areas (19.5 and 7.3 per 100,000 women giving birth). The lowest rates of maternal death were for women who lived in Outer regional areas and Major cities (5.1 and 5.7 per 100,000 women giving birth, respectively). The rate of maternal death in areas other than Major cities should be treated with caution due to small numbers.
Data on maternal deaths by selected maternal characteristics from 2014–2023 can be explored in the interactive visualisation below, with data also presented in Tables 4–8 of the supplementary data tables (Data tables: National Maternal Mortality Data Collection annual update 2023).
Figure 5: Maternal mortality ratio of women who gave birth, by selected maternal characteristic, 2014–2023
For the period 2014 to 2023, the maternal mortality ratio for women aged under 20 was 19.2 per 100,000 women giving birth.
Reference
WHO (World Health Organisation) (2025) Trends in maternal mortality estimates 2000 to 2023: estimates by WHO, UNICEF, UNFPA, World Bank Group and UNDESA/Population Division, WHO, accessed 28 October 2025.
If you or someone you know needs help, contact:
- Lifeline on 13 11 14
- Griefline on 1300 845 745
- Perinatal Anxiety and Depression Australia (PANDA) on 1300 726 306
- Suicide Call Back Service on 1300 659 467
- National Alcohol and Other Drug Hotline on 1800-250-015
- SANDS miscarriage, stillbirth and newborn death support 1300 308 307