Method of birth
Method of birth refers to how the baby was born, which may be vaginally or by caesarean section. When compared with non-instrumental vaginal births, instrumental vaginal births (vacuum or forceps) and caesarean section births can carry additional risks for mothers and babies, such as infection and physical trauma. Although each method carries risks, they are chosen by women and their healthcare providers to minimise complications and increase the likelihood of positive pregnancy outcomes (Victorian Department of Health and Human Services 2017).
For multiple births, women are categorised by the method of birth of the first-born baby.
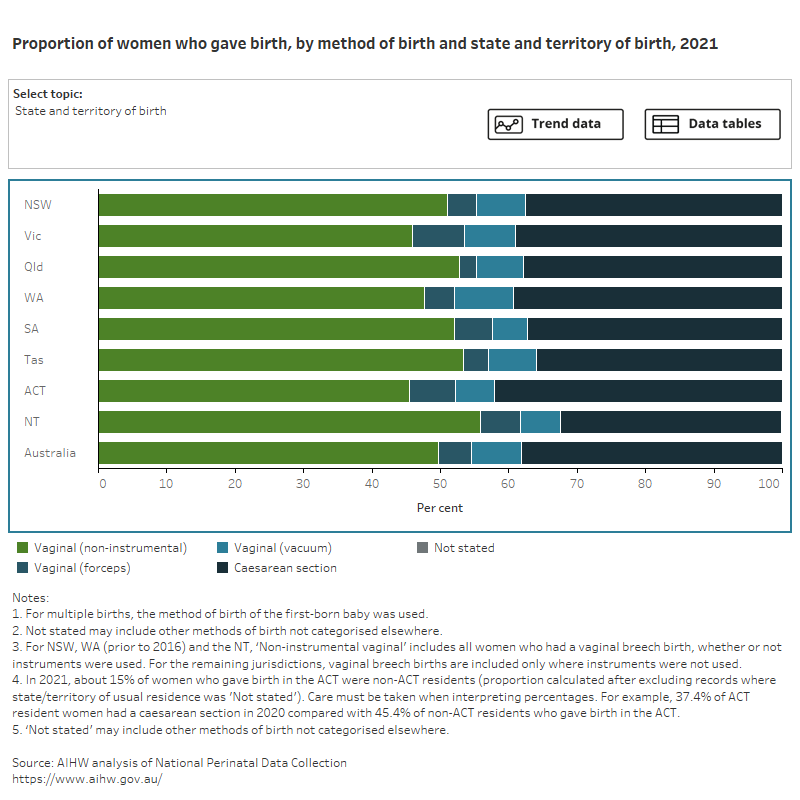
Over time, the proportion of women who had a vaginal non-instrumental birth has decreased, and the proportion of women who had a caesarean section birth has increased. Vaginal birth assisted by vacuum or forceps have remained relatively stable. In 2021:
- 50% of women had a non-instrumental vaginal birth (compared with 56% in 2011)
- 7.2% of women had a vaginal birth assisted by vacuum (compared with 7.9% in 2011)
- 4.9% of women had a vaginal birth assisted by forceps (compared with 4.2% in 2011)
- 38% of women had a caesarean section birth (compared with 32% in 2011).
Figure 1 presents data on the method of birth of women who gave birth, by selected maternal characteristics, for 2021. Select the trend button to see how data has changed over an 11-year period (where available).
Figure 1: Proportion of women who gave birth, by method of birth and selected topic
Bar chart shows method of birth by selected topics and a line graph shows topic trends between 2011 and 2021.

For more information on vaginal births and caesarean section births, expand the sections below.
In 2021, almost 2 in 3 women (62%) who gave birth in Australia had a vaginal birth. Non-instrumental vaginal births were more common for women whose babies were born at term (50%) or post-term (47%), who were teenage mothers (aged under 20) (65%) and who were underweight (56%) or normal weight (52%).
Instrumental vaginal birth (which includes both forceps and vacuum extraction) decreased with increasing parity and was much more common among women who had not previously given birth (9.5% for forceps and 12% for vacuum extraction) compared with women with a parity of 4 or more (0.5% for forceps and 1.8% for vacuum extraction).
The proportion of instrumental vaginal births assisted by forceps decreased with increasing remoteness (from 5.3% for Major cities to 3.2% for Very remote areas) and were more common among mothers whose babies were born post-term (8.4%, compared to 5.0% for mothers whose babies were born at term) and mothers who lived in the least disadvantaged areas (5.6%, compared to 4.0% for mothers who lived in the most disadvantaged areas).
The proportion of instrumental vaginal births assisted by vacuum extraction was higher for women who gave birth in private hospitals (9.2%, compared with 6.6% for public hospitals) and mothers who lived in the least disadvantaged areas (8.3%, compared to 5.8% for mothers who lived in the most disadvantaged areas).
For related information see National Core Maternity Indicators:
For more information on vaginal births see National Perinatal Data Collection annual update data table 2.35.
Caesarean section describes a method of birth in which the baby is removed directly from the uterus through an incision in the mother’s abdomen. This procedure is generally performed when vaginal birth is likely to pose a risk to the health of the mother or baby, or in scenarios such as stalled labour or unsuccessful vaginal birth.
While caesarean section is the safest and the most appropriate method of birth for many conditions and complications that can affect the mother and/or baby, the benefits need to be weighed against the risks (ACSQHC 2018). Risks to the mother include postoperative infection, haemorrhage, and complications during future pregnancies. Risks to the baby for planned caesarean section at less than 39 weeks’ gestation can include increased rates of neonatal respiratory issues, asthma, obesity and developmental issues (ACSQHC 2018).
In 2021, more than 1 in 3 mothers (38%) had a caesarean section birth. This is an increase from 32% in 2011. Mothers who had caesarean sections include all those who had no labour onset (64%) as well as those who required a caesarean section after labour started (36%).
Caesarean sections were more common among women whose babies were pre-term (51%), who were aged 40 and over (56%) and who were overweight (40%) and obese (46%).
Internationally, the caesarean section rate has been increasing in most Organisation for Economic Cooperation and Development (OECD) countries, including Australia, and Australia’s rate of 34 per 100 live births is higher than the OECD average of 28 per 100 live births (OECD 2019).
1 in 4 (27%) mothers had a primary caesarean section (that is, caesarean sections to mothers with no previous history of caesarean section). This rate was higher for first-time mothers (40%) and lower for mothers who had previously given birth (13%).
For related information see National Core Maternity Indicator Caesarean section
For more information on caesarean section births see National Perinatal Data Collection annual update data tables 2.36 and 2.37.
Having had a previous caesarean section can be associated with an increased risk of adverse outcomes for women and their babies during subsequent pregnancies, most often due to uterine scarring (Chauhan et al. 2003; Jamshed et al. 2022). However, many women who choose to give birth vaginally after having had a previous caesarean section are successful (RANZCOG 2022).
Most mothers who had a previous caesarean section had a repeat caesarean section (87%). Having had a previous caesarean section was the most common main reason for having a caesarean section.
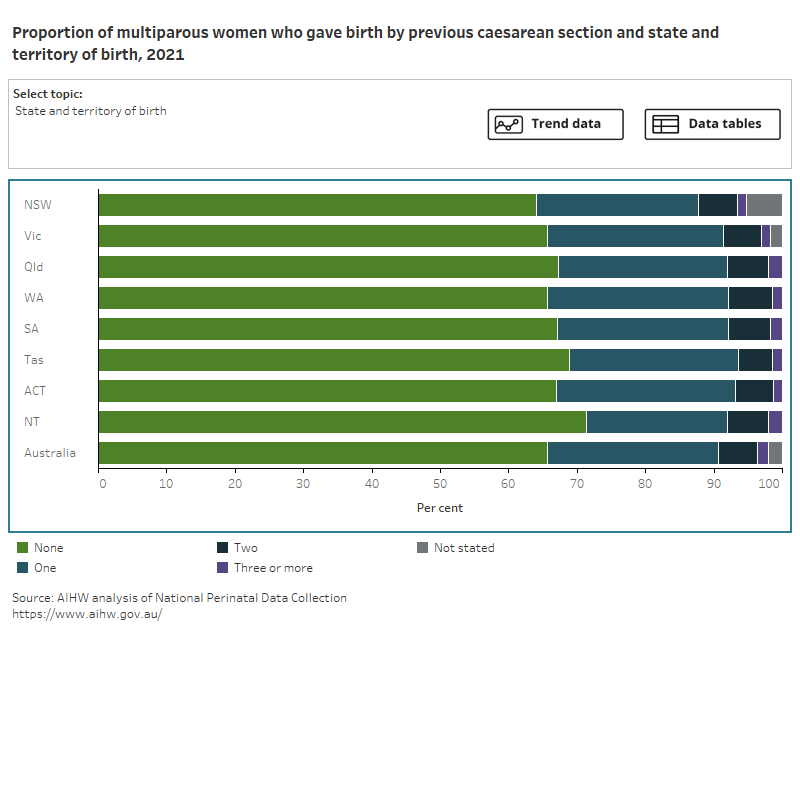
Figure 2 presents data on the history of caesarean section birth for women who have previously given birth, by selected maternal characteristics, for 2021. Select the trend button to see how data has changed over a 10-year period.
Figure 2: Proportion of women who gave birth, by previous caesarean section and selected topic
Bar chart shows previous caesarean sections by selected topics and a line graph shows topic trends between 2012 and 2021.

Of mothers who have previously given birth and had a caesarean section, 25% had one previous caesarean section, 5.8% had two previous caesarean sections, and 1.5% had had three or more. The number of previous caesarean sections differed little by remoteness or socioeconomic status of the mother’s usual residence.
For related information see National Core Maternity Indicator Women having their second birth vaginally whose first birth was by caesarean section
For more information on previous caesarean sections see National Perinatal Data Collection annual update data table 2.42.
In 2015, the World Health Organization (WHO) recommended that, rather than using a population-based estimate of caesarean section rate, the Robson 10 group classification system (Robson classification) be used to evaluate and compare caesarean section rates between groups of women (ACSQHC 2018; WHO SRH 2015).
The Robson classification allocates women into 10 mutually exclusive groups based on obstetric characteristics, such as the number of previous pregnancies, onset of labour, whether there has been a previous caesarean section, and the baby’s gestational age (WHO 2018; WHO SRH 2015). This can provide a more detailed understanding of the relatively high caesarean section rate in Australia and can be used to inform targeted intervention.
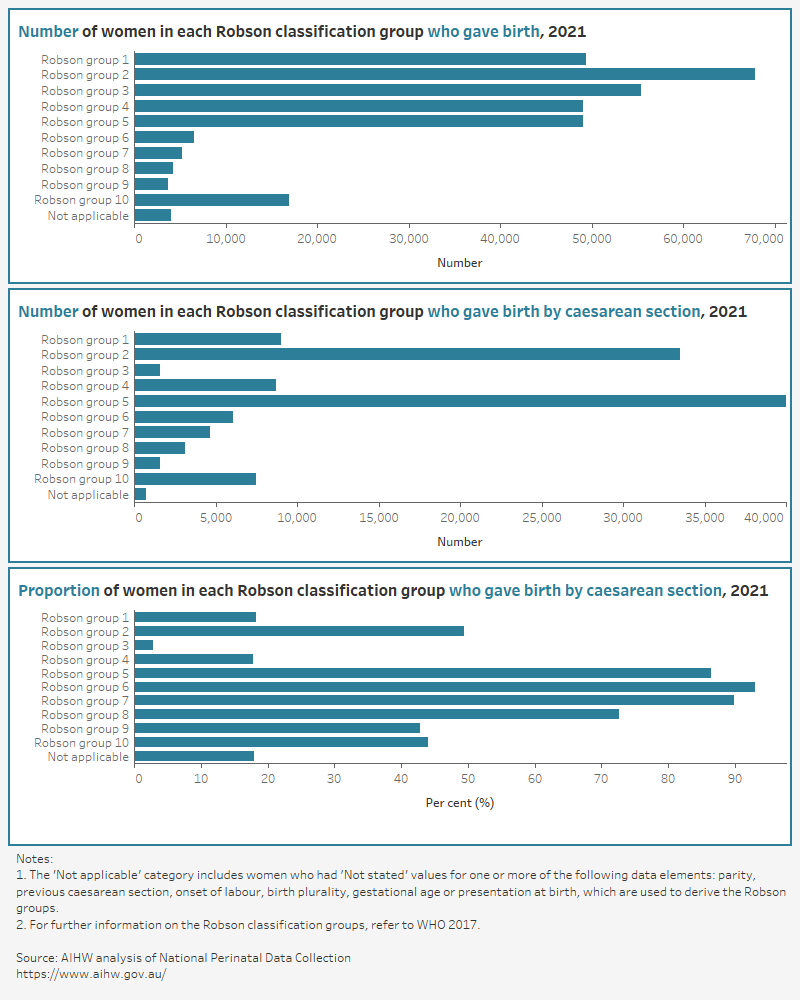
First-time mothers with a breech pregnancy (baby is delivered buttocks or feet first) (Robson group 6) were most likely to have a caesarean section (93%), followed by mothers who have previously given birth with a breech pregnancy (90%, Robson group 7) and those with singleton pregnancies near term who had had one or more previous caesarean sections (86%, Robson group 5).
Figure 3 presents data on the number and proportion of women who gave birth, by Robson group, in 2021.
Figure 3: Number of women in each Robson classification group
3 bar charts showing number and proportion of women who gave birth by caesarean section and Robson classification group.

For more information on the Robson classification of caesarean sections see National Perinatal Data Collection annual update data table 2.44.
References
ACSQHC (Australian Commission on Safety and Quality in Health Care) (2018) The second Australian atlas of healthcare variation, ACSQHC, accessed 3 January 2018.
Chauhan SP, Martin JN, Henrichs CE, Morrison JC and Magann EF (2003) ‘Maternal and perinatal complications with uterine rupture in 142,075 patients who attempted vaginal birth after cesarean delivery: a review of the literature’, American Journal of Obstetrics Gynecology, 189(2):408–417, doi:10.1067/s0002-9378(03)00675-6.
Jamshed S, Chien SC, Tanweer A, Asdary RN, Hardhantyo M, Greenfield D, Chien CH, Weng SF, Jian WS and Iqbal U (2022) ‘Correlation between previous caesarean section and adverse maternal outcomes accordingly with Robson classification: systematic review and meta-analysis’, Frontiers in Medicine, 10(8):740000, doi:10.3389/fmed.2021.740000.
OECD (Organisation for Economic Co-operation and Development) (2019) Health at a glance 2019: OECD indicators, OECD, accessed 13 April 2021.
RANZCOG (Royal Australian and New Zealand College of Obstetricians and Gynaecologists) (2019) Birth after previous caesarean section, RANZCOG, accessed 11 May 2022.
Victorian Department of Health and Human Services (2017) Caesarean section, Victorian Department of Health and Human Services, Victorian Government, accessed 31 May 2022.
WHO (World Health Organization) (2017) Robson classification: implementation manual, WHO, accessed 10 May 2018.
WHO SRH (World Health Organization Sexual and Reproductive Health and Research) (2015) WHO statement on caesarean section rates, reference number WHO/RHR/15.02, WHO SRH, accessed 21 November 2018.


