Methods
Calculation of rates and ratios
Age-specific rates
An age-specific rate is defined as the number of events for a specified age group over a specified period (for example, a year) divided by the total population exposed to the event in that age group.
Age-standardised rates
Age-standardised rates enable comparisons to be made between populations that have different age structures. Direct standardisation, in which the age-specific rates are multiplied by a constant population, was used in this report. This effectively removes the influence of the age structure on the summary rate. The report states where age-standardised rates have been used.
All age-standardised rates in this report have used the June 2001 Australian female estimated resident population aged 15–44 years as the standard population. For more information refer to the Metadata Online Registry for age-standardised rates.
Crude rates
A crude rate is defined as the number of events over a specified period (for example, a year) divided by the total population exposed to the event.
Maternal mortality ratio
The incidence of maternal death is expressed as the maternal mortality ratio (MMR), which is calculated using direct and indirect deaths combined, and excludes coincidental deaths.
Although the most appropriate denominator for estimating maternal mortality would be the number of women at risk (the number of pregnant or recently pregnant women), this number is not available in Australia because the number of pregnancies ending before 20 weeks’ gestation is unknown. In Australia, accurate population data are available for the number of women who gave birth to at least 1 baby (either a live birth or a stillbirth) of 20 weeks’ completed gestation or more or birthweight of 400 grams or more and are held in the AIHW’s National Perinatal Data Collection; this is the denominator number used when calculating the MMR in this report.
MMR = (Number of direct and indirect maternal deaths(a)) / (Number of women who gave birth(a)) x 100,000
(a) For a defined place and time.
Perinatal mortality rate
The perinatal mortality rate is calculated as the proportion of births in a specified population which are stillbirths or neonatal deaths (perinatal deaths). This proportion is expressed in relation to all births.
Perinatal mortality rate = 1,000 x Number of perinatal deaths / Total number of births
Stillbirth rate
The stillbirth rate is calculated as the proportion of births in a specified population which are stillbirths. This proportion is expressed in relation to all births.
Stillbirth rate = 1,000 x Number of stillbirths / Total number of births
Neonatal mortality rate
The neonatal mortality rate is calculated as the proportion of births in a specified population which are live born and subsequently die within 28 days of birth (neonatal deaths). This proportion is expressed in relation to all live births.
Neonatal mortality rate = 1,000 x Number of neonatal deaths / Number of live births
Rate ratio
Rate ratios presented in the National Perinatal Data Collection annual update data tables are calculated by dividing the proportion of the study population (for example, First Nations Australians) with a particular characteristic by the proportion of the standard population (for example, non-Indigenous Australians) with the same characteristic.
A rate ratio of 1 indicates that the prevalence of the characteristic is the same in the study and standard populations. Rate ratios of greater than 1 indicate higher prevalence in the study population; rate ratios of less than 1 indicate higher prevalence in the standard population.
Geography
Geographic data are based on the usual residence of the mother. Prior to 2017, the usual residence of the mother is based on Statistical Area Level 2 (SA2) of the Australian Bureau of Statistics Australian Statistical Geography Standard (ABS ASGS) Edition 2011 for all states and territories.
Between 2017 and 2021, the usual residence of the mother is based on SA2 of the ABS ASGS Edition 2016 for all states and territories.
For 2022, the usual residence of the mother is based on SA2 of the ABS ASGS Edition 2016 for WA, SA, NT and November and December for ACT, and SA2 of the ABS ASGS Edition 2021 for NSW, Vic, Qld, Tas and January to October for ACT.
From 2023 onwards, the usual residence of the mother is based on SA2 of the ABS ASGS Edition 2021 for all states and territories.
Primary Health Network
Primary Health Networks (PHNs) have been established by the Department of Health to increase the efficiency and effectiveness of medical services and improve the coordination of care for patients.
Perinatal data at Statistical Area Level 2 (SA2) were linked to PHNs boundaries using Australian Bureau of Statistics (ABS) correspondence files. Prior to 2017 the 2015 PHNs were used, the 2017 PHNs boundaries were used between 2017 and 2022 and the 2023 PHNs were used from 2023.
The relevant proportion for each PHN was then calculated, and categories were developed based on the median, interquartile ranges and 10th and 90th percentiles for the proportions at the PHN level. The categories were then adjusted to account for natural breaks in the distribution of the data and for easier interpretation (for example, a range with a maximum of 52.1% of mothers receiving antenatal care in the first trimester would be revised to a maximum of 50%). PHNs were allocated to categories based on unrounded proportions.
Remoteness
This report uses the Australian Statistical Geography Standard Remoteness Structure, which groups geographic areas into six classes of Remoteness Area based on their relative access to services using the Accessibility/Remoteness Index of Australia.
The six classes are: Major cities, Inner regional, Outer regional, Remote, Very remote and Migratory, see the Australian Statistical Geography Standard (ASGS) Edition 3: Remoteness Areas, July 2021 (ABS 2023a).
Remoteness data used in this report are derived by applying this classification to the mother’s usual area of residence in the NPDC. Remoteness area was calculated where geographic area of usual residence was provided
Socioeconomic status
The Socio-Economic Indexes for Areas (SEIFA) are measures of socioeconomic status (SES) that summarise a range of socioeconomic variables associated with disadvantage. Socioeconomic disadvantage is typically associated with low income, high unemployment and low levels of education.
The SEIFA index used in this report is the 2012 SEIFA Index of Relative Socioeconomic Disadvantage (IRSD), the 2016 SEIFA IRSD and the 2021 SEIFA IRSD, developed by the Australian Bureau of Statistics for use at Statistical Area Level 2.
Since the IRSD summarises only variables that indicate disadvantage, a low score indicates that an area has many low-income families, many people with little training and many people working in unskilled occupations; hence, this area may be considered disadvantaged relative to other areas. A high score implies that the area has few families with low incomes and few people with little or no training and working in unskilled occupations. These areas with high index scores may be considered less disadvantaged relative to other areas. It is important to understand that a high score reflects a relative lack of disadvantage rather than advantage and that the IRSD relates to the average disadvantage of all people living in a geographic area. It cannot be presumed to apply to all individuals living within the area.
Population-based Australian cut-offs for SEIFA quintiles have been used in this report. This method ranks the SEIFA scores for a particular geography (for example, Statistical Area Level 2) from lowest to highest, and the geographical areas are divided into 5 groups, such that approximately 20% of the population are in each group.
The lowest socioeconomic status areas are referred to as Q1 (most disadvantaged) and the highest socioeconomic status areas are referred to as Q5 (least disadvantaged).
See the Socio-Economic Indexes for Areas (SEIFA), Australia, 2021 (ABS 2023b) for further information on SEIFA.
Statistical Area Level 3
Statistical Areas Level 3 (SA3) are geographical areas built from whole Statistical Areas Level 2 (SA2) and are designed for the output of regional data. SA3s create a standard framework for the analysis of ABS data at the regional level through clustering groups of SA2s that have similar regional characteristics. Whole SA3s aggregate to form Statistical Areas Level 4 (SA4). There are 358 spatial SA3 regions covering the whole of Australia without gaps or overlaps (ABS 2018b).
Perinatal data at Statistical Area Level 2 (SA2) were linked to Statistical Area Level 3 (SA3) using Australian Bureau of Statistics correspondence files.
Trend data
The methods below refer to National Perinatal Data Collection annual update data tables 1.2 and 1.3, and National Perinatal Mortality Data Collection annual update tables 1 and 5.
Annual change
The average annual change (slope estimate) is calculated using the ordinary least squares method of linear regression. The method calculates a straight line that best fits the data (the fitted linear regression line) and returns an equation that best describes the line.
The form of the straight-line equation is:
Y = a + bX
where:
b is the average annual change or ‘slope’ over the period
X is the independent or predictor variable (in the case of time trend analysis, this is the year)
a is the y-intercept
Y is the predicted value of the rate based on the fitted linear regression line.
Percentage change
Percentage change is determined by multiplying the average annual change (slope estimate) over the period by the number of data points less 1. This is then divided by the Y value calculated for the first year in the series (based on the fitted linear regression line) and multiplied by 100.
Statistical significance of trend data
For trend analyses, the 95% confidence intervals (CIs) for the standard error of the slope estimate (average annual change) were used to determine whether the apparent increases or decreases in the data are statistically significant at the p <0.05 level. The formula used to calculate the CIs for the standard error of the slope estimate is:
95% CI(x) = x ± 1.96 x SE(x)
where:
x is the average annual change (slope estimate).
If the upper and lower 95% CIs do not include zero, it can be concluded that there is statistical evidence of an increasing or decreasing trend in the data over the study period.
Significant changes are denoted with a ‘*’ against the percentage change statistics included in relevant tables.
Time trends
Linear regression has been used to determine changes in the observed rates over specified time periods. Regression modelling analyses the series of rates jointly rather than individually, thus accounting for volatility in observed rates over time and resulting in narrower confidence intervals around the set of predicted values than if the confidence limits were calculated around the rates separately.
Perinatal mortality trend
In the Stillbirths and neonatal deaths chapter, linear regression has been used to determine changes in the observed perinatal mortality rates over the period 2003–2021. In 2002 and 2009 data were not available from all jurisdictions so these years have been excluded from trend analysis. These data points are still presented in the accompanying National Perinatal Mortality Data Collection annual update supplementary data tables.
Gestational age in perinatal mortality reporting
Information on gestational age in perinatal mortality reporting is drawn from the National Perinatal Data Collection (NPDC) and reflects the gestational age at birth. While most fetal deaths leading to a stillbirth occur in the week prior to the associated birth event, some may occur more than a week prior. As a result, some stillbirths will be categorised in a later gestational interval than would be the case if date of death was used. For example, where the death occurs at 21 weeks’ gestation and the birth occurs a week later, the reported gestational age will be 22 weeks. This may also mean that some stillbirths occurring before 20 weeks’ gestation are included in later gestational age intervals. The National Perinatal Mortality Data Collection does not collect information on the confirmed date of death for stillbirths.
Confidentiality
To maintain privacy and confidentiality of individuals, cells in the data tables are suppressed if there is a risk of disclosure of an attribute of an individual that was not already known. A cell in a table is considered identifiable if, as well as being able to identify the entity, other details are also revealed. It is AIHW policy that these cells need to be confidentialised, unless the attribute that would be disclosed is deemed to be non-sensitive in the context of the data being published.
Small numbers
Numbers of less than 5 have not been published (n.p.), in line with guidelines for protecting the privacy of individuals. Exceptions to this are small numbers in ‘Other’ and ‘Not stated’ categories. Consequential suppression of numbers has also been applied where required to prevent back-calculation of small numbers. However, all suppressed numbers have been included in the totals.
Per cents based on denominators of less than 100 have also been suppressed (n.p.) for reliability reasons.
Australian national birthweight percentiles by gestational age
Three birthweight percentile charts are available in the National Perinatal Data Collection annual update data tables. These are:
- Table 7.1: Australian birthweight percentiles for liveborn singleton babies, by sex and gestational age, 2004 to 2013
- Table 7.2: Australian birthweight percentiles for liveborn singleton babies, by sex and gestational age, 2013 to 2022 and
- Table 7.2: Australian birthweight percentiles for liveborn twin babies, by sex and gestational age, 2013 to 2022.
For all tables, birthweight percentiles were calculated from data on all liveborn babies born in Australia. For singletons, records with gestational ages 20-44 weeks were included. For twins, records with gestational ages 20-42 weeks were included.
All records where sex was other than 'female' or 'male' were excluded from analysis. Records with missing or not stated data for sex, plurality, birthweight or gestational age were also excluded. Birthweight outliers were calculated and excluded using a method based on Tukey’s box and whisker plots.
Gestational age is reported in completed weeks of gestation, calculated from the first day of the last menstrual period (LMP) or estimated by prenatal and/or postnatal assessment if the LMP date was missing. Birthweight is reported to the nearest 5 grams.
Small for gestational age is defined as babies with birthweight below the 10th percentile according to the national birthweight percentiles for the period 2004 to 2013.
For more information on data used to assign percentiles used for analysis in current AIHW reports, see National Perinatal Data Collection annual update data table 7.1.
Robson 10 group classification system
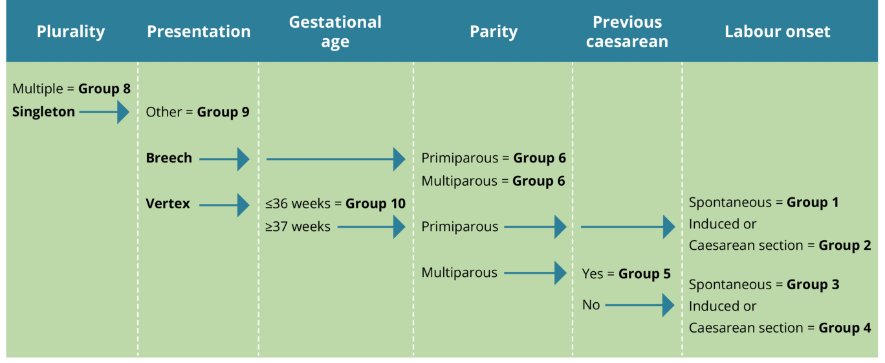
The Robson 10 group classification system (Robson classification) categorises women who gave birth into 10 mutually exclusive groups (Table 1). In addition, groups 2 and 4 can be further broken down into subgroups. These subgroups are used to differentiate between women who were induced and who had a caesarean section before labour onset.
| Group | Definition |
|---|---|
| 1 | First-time mother, singleton pregnancy, baby in cephalic (head first) presentation, ≥37 weeks gestation, spontaneous labour (not induced) |
| 2 | First-time mother, singleton pregnancy, baby in cephalic (head first) presentation, ≥37 weeks gestation, induced labour or caesarean section before labour |
| 3 | Mother has previously given birth without a previous caesarean scar, singleton pregnancy, baby in cephalic (head first) presentation, ≥37 weeks gestation, spontaneous labour (not induced) |
| 4 | Mother has previously given birth without a previous caesarean scar, singleton pregnancy, baby in cephalic (head first) presentation, ≥37 weeks gestation, induced labour or caesarean section before labour |
| 5 | Mother has previously given birth with a previous caesarean scar, singleton pregnancy, baby in cephalic (head first) presentation, ≥37 weeks gestation, induced labour or caesarean section before labour |
| 6 | First-time mother, singleton pregnancy, baby in breech (feet first) presentation |
| 7 | Mother has previously given birth with current singleton baby in breech (feet first) presentation |
| 8 | Multiple pregnancy, including women with previous caesarean scars |
| 9 | All women with a singleton pregnancy, baby in transverse (side on) or oblique lie, including women with previous caesarean scars |
| 10 | All women with a singleton pregnancy, baby in cephalic (head first) presentation, ≤36 weeks gestation, including women with previous caesarean scars |
The Robson classification groups and subgroups were calculated from data on all women who gave birth in Australia for 2023. Data elements used for calculation of the groups and subgroups were parity, previous caesarean sections, onset of labour, birth plurality, gestational age, presentation at birth and method of birth.
Records for whom one or more of the following variables were not stated: parity, previous caesarean sections, onset of labour, birth plurality, gestational age and presentation at birth; were grouped into the ‘Not applicable’ category. The denominator of ‘Number of women who gave birth’ includes women with a ‘not stated’ method of birth.
The figure describes the process of categorising all women who gave birth into the 10 groups and the additional subgroups.
Figure 1: Process flow of classification using the Robson 10 group classification system
References
ABS 2023a. Australian Statistical Geography Standard (ASGS) Edition 3: Remoteness Areas. ABS Website, accessed 8 April 2025.
ABS 2023b. Socio-Economic Indexes for Areas (SEIFA), Australia, 2021. ABS Website, accessed 8 April 2025.