Australia's youth:
Engagement in education or employment
Web article
Last updated:
Topic: Children & youth
Part of Australia's youth
Citation
AIHW (Australian Institute of Health and Welfare) (2021) Engagement in education or employment, AIHW, Australian Government, accessed 10 July 2026.
Key findings
- In May 2020, around 9 in 10 young people aged 15–24 were engaged in education and/or employment (88% or 2.8 million) – 4 percentage points less than in 2019 (92%).
- In May 2020, the proportion of young people who were considered NEET (not in employment, education or training) was more than twice as high for those living in the lowest socioeconomic areas as for those in the highest (18% or 96,000 compared with 8.7% or 66,000).
- The unemployment rate of young people aged 15–24 in the reference month of June for 2020 was 16%, an increase from 12% in 2019, and the highest rate since 1997. Monthly analysis since the COVID-19 pandemic began in March 2020 showed the rate peaked at 16.4% in July 2020 and was 11% in April 2021.
Participating in education or starting employment after concluding compulsory education helps individuals to develop abilities and skills and encourages a socially inclusive and productive society.
Not participating in either can contribute to future unemployment, lower incomes and employment insecurity (de Fontenay et al. 2020; Pech et al. 2009). Long‑term outcomes of unemployment and job loss can also include:
- poor physical and mental health
- family disruption
- decreased social participation
- and poor attainment and wellbeing for the children of unemployed people (Brand 2015; Green 2011).
Young people are particularly vulnerable in making the transition from school to further education or work. Some factors that can make this transition more difficult include:
- low educational outcomes
- the use of drugs and alcohol
- a dysfunctional family life
- health issues
- insufficient secure housing or homelessness
- welfare dependency
- and a lack of understanding of education and career pathways (Briggs et al. 2012; State Training Board of Western Australia 2013).
The majority of young people do manage this transition successfully. But a small proportion do not; if not in education, employment or training young people can experience social and economic disadvantage. Young people not in education, employment or training (NEET) are considered disengaged from work and training.
The proportion of young people who are NEET is an indicator of how smooth the transition from education into work is for young people (NCVER: Stanwick et al. 2014).
- It is a different measure than the unemployment rate, as it captures those who are inactive as well as those who are unemployed.
- It also differs from underemployment, which measures those who want, and are available for, more hours of work than they currently have (see Box 1).
Given the substantial potential consequences for society and individuals, young people who are NEET are a policy concern worldwide (OECD 2019).
Except for international comparisons, the data in this section largely cover the early months of the COVID-19 pandemic. Various restrictions and initiatives were in place in May 2020, in response to the pandemic, when data from the Australian Bureau of Statistics (ABS) Survey of Education and Work were collected (ABS 2020a; Storen & Corrigan 2020). These restrictions are likely to have had an impact on both the survey results and changes in engagement between 2020 and earlier years (ABS 2020a). For more information, see COVID-19 and the impact on young people.
Data on unemployment and underemployment among young people are presented in Box 2.
Box 1: Data sources and definitions for engagement in education or employment
ABS Labour Force Survey
Data from the ABS Labour Force Survey (LFS) are used in reporting unemployment and underemployment. The survey is a component of the Monthly Population Survey, and reports information on estimates of the civilian labour force population monthly. For definitions of unemployment and underemployment, see Technical notes.
As at April 2021, the ABS LFS questionnaire had not been changed in response to the COVID-19 pandemic (ABS 2021a). People who received the JobKeeper Payment were expected to answer questions in a way that would continue to classify them as employed. People who received the JobSeeker Payment would be classified based on their labour market activity. In response to COVID-19, the mutual obligation requirements that people must meet to receive the JobSeeker Payment (which could include looking for work or studying) were suspended in March 2020, and have been gradually reintroduced since August 2020 (DESE 2020).
These changes may have influenced whether people were actively searching for jobs, which would impact whether they were classified as 'unemployed' or 'not in the labour force' (but they would remain 'not employed') (ABS 2021a).
ABS Survey of Education and Work (SEW)
Data from the ABS Survey of Education and Work (SEW), a supplement to the Labour Force Survey, are reported here. The ABS SEW is conducted annually in early May of each year (details of the impacts of COVID-19 on the ABS SEW are on the ABS website Education and Work, Australia). The ABS SEW collects information on participation in education, non-school qualifications, transition from education to work, and current labour force and demographic characteristics for Australia’s population aged 15–74 (ABS 2020b).
The ABS SEW classifies a person’s level of engagement with study and/or work into 3 categories:
- fully engaged, which indicates that a person either studies full time, works full time, both studies and works part time, or both studies and works full time
- partially engaged, which indicates that a person either studies part time or works part time
- not engaged, which indicates that a person neither studies nor works, and is referred to in this section as NEET (ABS 2020b).
The changes to the JobSeeker Payment described earlier would not affect the proportion of those considered NEET as NEET includes those who are unemployed and those not in the labour force (ABS 2020b).
Note that the data source for NEET in this section (ABS SEW) differs to that used in COVID-19 and the impact on young people, which draws on data from the ABS LFS. This means that the proportions reported for May 2020 in the 2 sections of this report differ slightly.
Organisation for Economic Cooperation and Development: Youth not in employment, education or training (NEET)
The Organisation for the Economic Cooperation and Development: Youth not in employment, education or training (NEET) indicator presents the percentage of the total number of young people in the corresponding age group in selected countries who are NEET, alongside the Organisation for Economic Co-operation and Development (OECD) average. The OECD uses the same definition of NEET as the ABS, described earlier (OECD 2020).
How engaged are young people with education and employment?
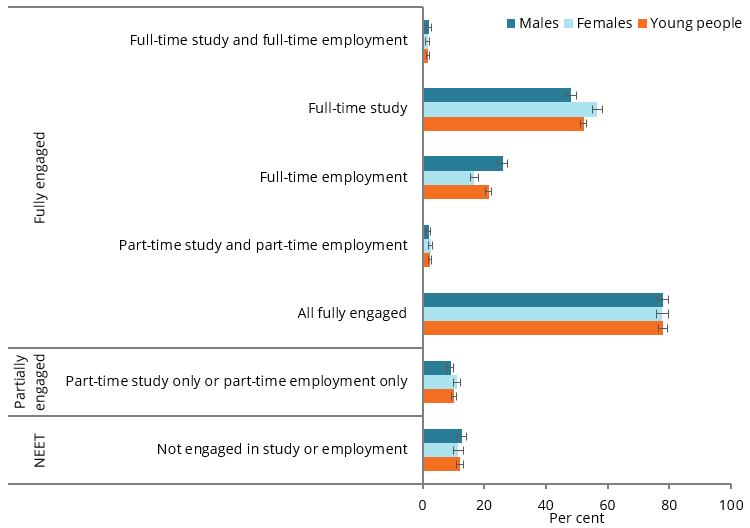
In May 2019, 92% of young people aged 15–24 were engaged at some level in education and/or employment. This dropped by 4 percentage points in May 2020 (to 88% or 2.8 million young people).
Between May 2019 and May 2020, among all young people aged 15–24, the proportion of those who were:
- fully engaged dropped from 81% to 78%, with similar proportions of males and females in 2020
- partially engaged remained similar, with 10% in 2020 and a lower proportion of males (9.1%) than females (11%) (ABS 2020c; Figure 1).
Full engagement can refer to work, study or a combination. Between May 2019 and May 2020, among all young people aged 15–24, the proportion of those who were:
- studying full-time (and not working) remained similar, with around half (52%) in 2020 and a higher proportion of females (57%) than males (48%)
- employed full time (and not studying) dropped from 25% to 21%, with a higher proportion of males (26%) than females (17%) in 2020
- in part-time study and part-time employment remained similar, with 2.3% in 2020 and similar proportions of males and females
- in both full-time study and full-time employment remained similar, with 1.7% in 2020 and similar proportions of males and females (ABS 2020c; Figure 1).
How many young people are considered NEET?
In May 2019, 8.4% of young people aged 15–24 were considered NEET (see Box 1). This increased by around 4 percentage points in May 2020 (to 12% or 391,000), with similar proportions of males and females (ABS 2020c; Figure 1).
Figure 1: Engagement in education and employment for young people aged 15–24, by sex, May 2020
Note: The calculated percentage includes people enrolled in school-level study.
Chart: AIHW.
Source: ABS 2020c.
How has engagement in education and employment changed over time?
Between May 2004 and May 2020, among young people aged 15–24, the proportion who were:
- fully engaged remained steady from 2004 to 2019 (around 81%), then fell by 3 percentage points in 2020 (78%). This was due predominantly to a decrease for males (83% to 78%, from 2019 to 2020) (ABS 2020c)
- partially engaged generally increased (8.4% to 10%), with similar proportions between 2019 and 2020; this was true for both males and females (ABS 2020c)
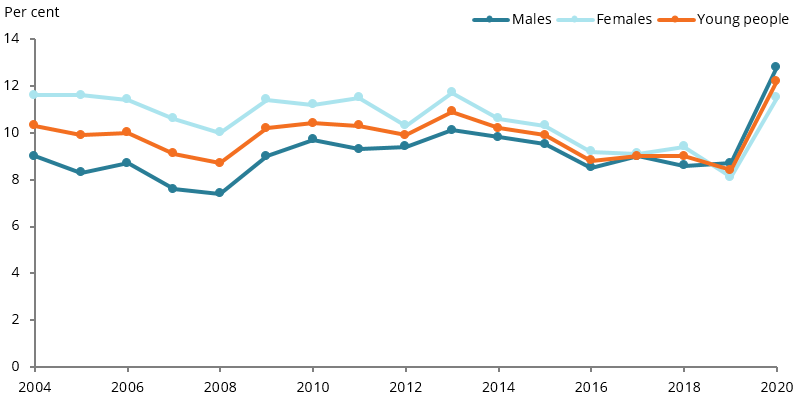
- considered NEET fell from 2004 to 2008, sharply rose in 2009 (coinciding with the Global Financial Crisis) and then generally fell again until 2019, due predominantly to a drop in females considered to be NEET. In 2020, amid the early stages of the COVID-19 pandemic, the proportion considered NEET increased to the highest levels in 16 years (12% of all young people) (Figure 2). For changes to the proportion of young people considered NEET between May 2020 and February 2021, see Education, in COVID-19 and the impact on young people.
Figure 2: Young people aged 15–24 who were NEET, by sex, May 2004 to May 2020
Note: The calculated percentage includes people enrolled in school-level study.
Chart: AIHW.
Source: ABS 2020c.
Is engagement in education and employment the same for everyone?
From May 2019 to May 2020, the proportion who were fully engaged was similar for most population groups but decreased for those from Major cities (83% to 79%) and those born in Australia (80% to 77%) (ABS 2020c). The COVID-19 pandemic is likely to have played a role in these changes.
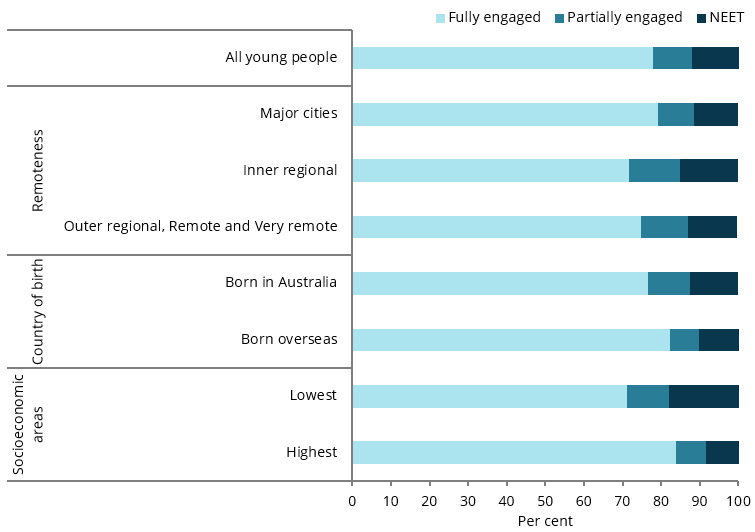
In May 2020, the proportion of young people aged 15–24 who were fully engaged varied across some population groups. It was:
- higher for those living in Major cities than those living in Inner regional areas
- lower for those born in Australia than those born overseas
- lower for those living in the lowest socioeconomic areas than for those living in the highest (Figure 3).
The proportion of young people who were partially engaged was similar between May 2019 and May 2020.
In May 2020, the proportion of young people who were partially engaged was:
- lower for those living in Major cities than those living in Inner regional areas
- higher for those born in Australia than those born overseas
- higher for those living in the lowest socioeconomic areas than those living in the highest (Figure 3).
From May 2019 to May 2020, the proportion of young people who were NEET rose for those from Major cities (6.8% to 12%), those born in Australia (8.5% to 13%) and from those living in the highest socioeconomic areas (4.5% to 8.7%) (ABS 2020c).
These findings are consistent with an AIHW analysis of the Department of Social Services’ JobSeeker Payment and Youth Allowance recipients – monthly profile on data.gov.au (DSS 2020). This analysis showed that, from March to May 2020, there was a disproportionate increase in the number of people aged 15–69 receiving unemployment payments (JobSeeker Payment or Youth Allowance (other)) in Major cities compared with other remoteness areas (see Technical notes). Unemployment payment recipients more than doubled in Major cities (from 545,000 to 1.1 million, a 103% increase), with the next largest increase in Inner regional areas (from around 198,000 to 318,000, a 61% increase) (AIHW unpublished). The COVID-19 pandemic is likely to have played a role in these changes. For information on young people receiving JobSeeker and JobKeeper payments and other forms of income support, see Income support for young people.
In May 2020, the proportion of young people who were considered NEET was:
- lower for those living in Major cities than for those living in Inner regional areas
- similar for those born in Australia and those born overseas
- higher for those in the lowest socioeconomic areas than for those in the highest areas (Figure 3).
Figure 3: Engagement in education and employment for young people aged 15–24 from selected population groups, May 2020
Note: The calculated percentage includes people enrolled in school-level study.
Chart: AIHW.
Source: ABS 2020c.
Box 2: Youth unemployment and underemployment
Youth unemployment
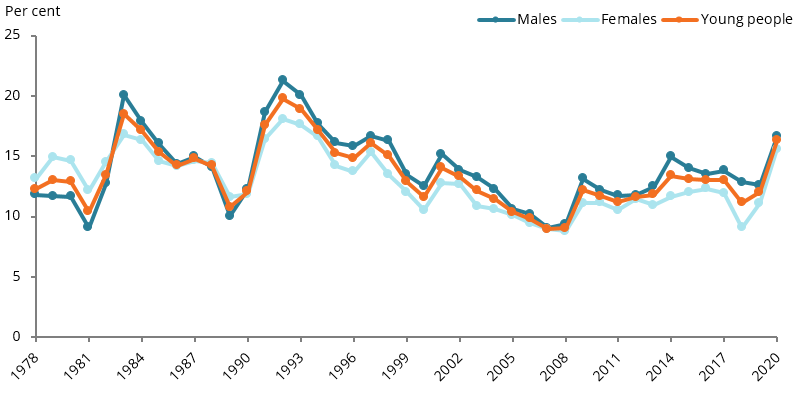
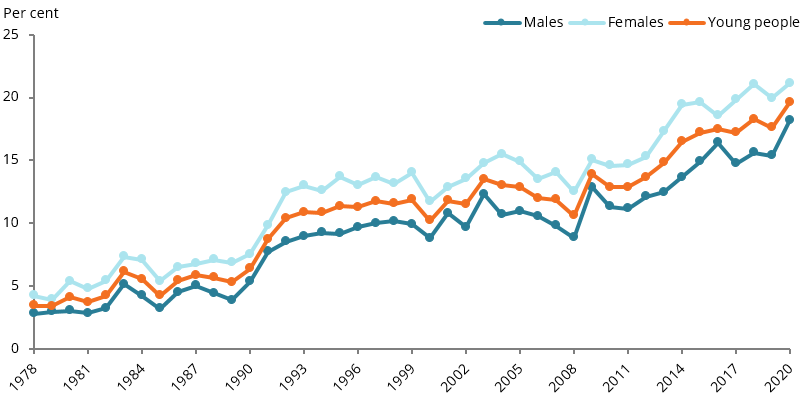
Based on an analysis of annual seasonally adjusted LFS data from 1978 to 2020 for the reference month of June for each year, the unemployment rate of young people aged 15–24 in 2020 was 16% (or 329,000), an increase from 12% (or 264,000) in 2019. This was the highest rate for the reference month of June since 1997 (16% or 292,000) (Figure 4) (For definitions and explanations of labour force data see Box 1).
Between 2000 and 2020, the unemployment rate of young people was lowest in 2007 before the Global Financial Crisis, at 9.0% (or 182,000) (Figure 4). The unemployment rate for males aged 15–24 was 17% (or 172,000) in June 2020, up from 13% (or 142,000) in June 2019 (Figure 4). For females of the same age group for the same months, the rate was 16% (or 154,000) in 2020, up from 11% (or 119,000) in 2019 (Figure 4).
Figure 4: Unemployment rate of young people aged 15–24, by sex, June 1978 to June 2020
Note: Proportions are seasonally adjusted for June of each year.
Chart: AIHW.
Source: ABS 2021a.
An analysis of changes in monthly seasonally adjusted labour force statistics for young people since the COVID-19 pandemic began in March 2020 showed that the unemployment rate rose substantially from 12% in March 2020 to 16% in May 2020. The rate remained at 16% in June 2020 and peaked at 16.4% in July 2020. The rate fell in August (14%), but returned to 16% in November 2020 (representing, in part, the effect of Victoria’s increased restrictions). In April 2021, the unemployment rate was 11% (or 228,000 unemployed young people) compared with 12% in March 2020 (ABS 2021a) (see also COVID-19 and the impact on young people).
Youth underemployment
Youth who are underemployed want, and are available for, more hours of work than they currently have (for a more detailed definition, see Technical notes) (ABS 2021b). Since 1978, the proportion of young people aged 15–24 in the labour force who are underemployed (the underemployment rate) has steadily increased from 3.4% to 18% in 2019. This is true for both males and females.
In June 2020, the underemployment rate of young people was 20% (or 397,000), an increase from 18% (or 387,000) in June 2019. The underemployment rate increased for young males between 2019 and 2020 (from 15% (or 172,000) to 18% (or 188,000)) while the underemployment rate of females continued to vary between 20–21% (Figure 5).
Figure 5: Underemployment rate of young people aged 15–24, by sex, 30 June 1978 to 30 June 2020
Note: Proportions are seasonally adjusted for June each year.
Chart: AIHW.
Source: ABS 2021a.
An analysis of monthly seasonally adjusted labour force data since the COVID-19 pandemic began showed that the underemployment rate of young people rose substantially from March 2020 (19%) to April 2020 (24%). The rate then steadily fell, returning to pre-COVID-19 levels (March 2020) by June 2020 (20%). The underemployment rate has remained stable since (17% in April 2021) (ABS 2021a). See COVID-19 and the impact on young people for further discussion of changes in labour force statistics during COVID-19 pandemic.
How does engagement in education and employment in Australia compare internationally?
In 2019, compared with the OECD average, the proportion of young people in Australia who were considered NEET was
- similar for 15–19 year olds (5.9% compared with the OECD average of 6.4%)
- lower for 20–24 year olds (11% compared with the OECD average of 15%) (OECD 2020) (figures 6 and 7)
These patterns were consistent for both males and females across both age groups (OECD 2020).
From 2000 to 2019, compared with the OECD average, the proportion of young people in Australia who were considered NEET was:
- lower for 15–19 year olds until 2008, and has been around the OECD average since
- consistently lower for 20–24 year olds (OECD 2020).
Figure 6: Young people who are NEET aged 15–19, by selected OECD countries, 2019
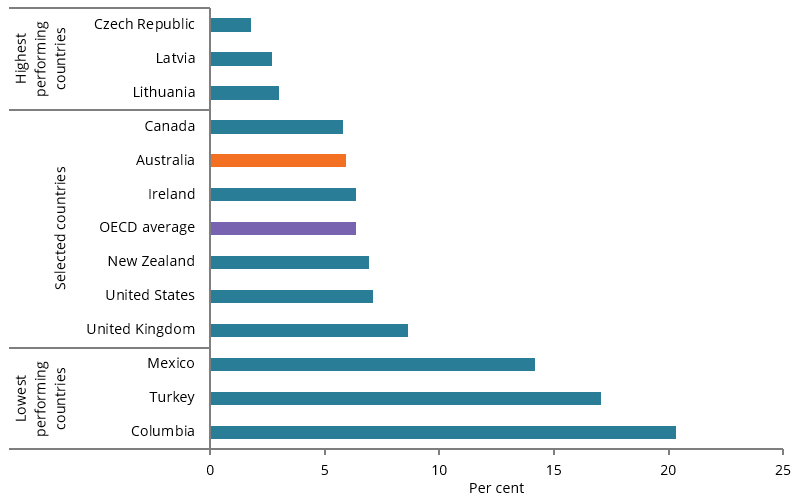
Notes
- 2018 data were used for the United States in the comparison as they are not available for 2019.
- Selected countries include only main English-speaking OECD countries for comparison. For a comparison including all OECD countries, see OECD 2020.
Chart: AIHW.
Source: OECD 2020.
Figure 7: Young people who are NEET aged 20–24, by selected OECD countries, 2019
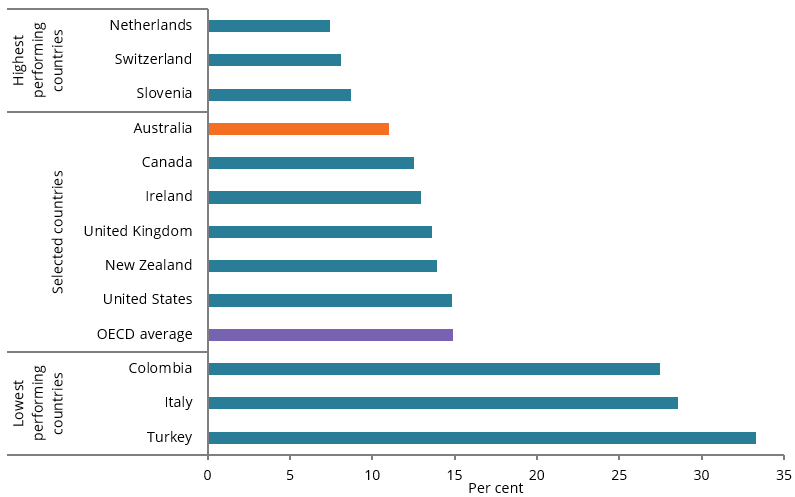
Notes
- 2018 data were used for the United States in the comparison as they were not available for 2019.
- Selected countries include only main English-speaking OECD countries for comparison. For a comparison including all OECD countries, see OECD 2020.
Chart: AIHW.
Source: OECD 2020.
Where do I find more information?
For more information on Indigenous young people and engagement in employment or education, see:
- Section 2.07, Employment of Aboriginal and Torres Strait Islander Health Performance Framework (HPF) report 2020 or sections 3.1, Education and 3.2, Employment of Aboriginal and Torres Strait Islander adolescent and youth health and wellbeing 2018.
For more information on trends in employment and engagement, see: