Australia's youth:
Peer relationships and social networks
Web article
Last updated:
Topic: Children & youth
Part of Australia's youth
Citation
AIHW (Australian Institute of Health and Welfare) (2021) Peer relationships and social networks, AIHW, Australian Government, accessed 12 July 2026.
Key findings
- In 2018, the majority of 18 and 24 year olds (92% and 94%, respectively) could ask someone for any type of support in a time of crisis if they needed to.
- The most commonly reported person to whom 18 and 24 year olds turned was a family member, followed by a friend, and partner or boyfriend/girlfriend.
- In 2018, 1 in 5 (21%) young people aged 15–24 reported that they often felt very lonely.
During adolescence, the social networks of young people become more complex. As they become more independent from their families, they spend more time with their peers, and place greater value on their peer relationships (Rohrbeck & Gavin 2014).
- In 2020, over 4 in 5 (83%) respondents aged 15–19 rated their friendships as being either extremely important (41%) or very important (42%), which was a little higher than the rating given to family (79%) (see also Family relationships (Tiller et al. 2020)).
Social connections – how connected and engaged people are, how and with whom they spend their time, the quantity and quality of time spent with others, and how supported people feel – are an important dimension of quality of life (OECD 2020). Peers, though, can be both a positive and a negative influence.
- Good peer relationships can foster positive outcomes in social, emotional and academic domains (Rohrbeck & Gavin 2014). They can be fun; they can also provide an emotional support, a safe environment to explore one’s self‑concept and a buffer against difficult relationships at home or school (Rohrbeck & Gavin 2014). As Amichai-Hamburger notes (2013), an important benefit of having friends is the various forms of support (social and material) they can provide in times of stress.
- Negative peer influence, as well as isolation and lack of peer relationships, is a risk factor for antisocial and problematic behaviours, and is also often blamed for risky behaviours (Rohrbeck & Gavin 2014).
Electronic media, including text messaging, email, online chats, interactive video games and electronic social media (see Box 3), has introduced a range of new contexts and changed how young people interact (Rohrbeck & Gavin 2014). It can be positive in terms of greater opportunities for social connection; however, it can also lead to negative online behaviours (see Bullying and negative online experiences).
Box 1: Data sources on peer relationships and social networks
The Longitudinal Study of Australian Children (LSAC) is a major study, which began in 2004 and follows the development of Australian children. The survey collects information on physical and mental health; education; and social, cognitive and emotional development. The data are sourced from parents, child carers, educators and the children themselves.
Population estimates from the LSAC represent the population of Australian children born in Australia between March 2003 and February 2004 (B cohort) and those born between March 1999 and February 2000 (K cohort). These 2 cohorts of children totalled more than 10,000 children at the outset of the study in 2004. (Data are not representative of children who migrated to Australia.)
The Household, Income and Labour Dynamics in Australia (HILDA) study is a nationally representative longitudinal household study that began in 2001. It follows the lives of more than 17,000 Australians, over the course of their life. The survey collects information on many aspects of life in Australia, including household and family relationships, income and employment, and health and education. The same households and individuals are interviewed every year, to see how their lives are changing over time. The survey follows not only the initial sample members for the remainder of their lives, but also their children and all subsequent descendants.
The Longitudinal Surveys of Australian Youth (LSAY) follows young Australians over 10 years as they move through school to further study, work and beyond. Survey participants enter the study when they are about 15 years old and are then contacted once a year until they turn 25. Nationally representative samples of over 10,000 young people start out in each cohort.
Since 2003, participants have been recruited from Australian schools that take part in the Programme for International Student Assessment (PISA). Information collected includes student achievement and aspirations, attitudes to school, social background, vocational and further education, employment and job seeking, and satisfaction with various aspects of life. Groups of survey participants are known as ‘cohorts’. Cohorts Y09 and Y15, which began in 2009 and 2015, respectively, are included in this report.
Variation across population groups
While the data collections LSAC and HILDA include variables to support the disaggregation of data by remoteness and socioeconomic areas, in many cases findings were not statistically significant, and so are not reported here. This may be due in part to small sample sizes.
What is the quality of friendships among 16–17 year olds?
In 2016, based on data from the LSAC, most young people aged 16–17 (98%) reported that they had at least 1 good friend (84% reported it was certainly true, and 14% that it was somewhat true).
Based on data that used the Peer Attachment Scale (see Box 2), a high proportion of young people also responded positively to measures of trust. For the majority, it was almost always true/often true/sometimes true that their friends:
- were people they trusted (91%)
- were good friends (90%)
- respected their feelings (91%)
- listened to what they had to say (90%) (Figure 1).
There was little difference between males and females.
A high proportion of young people responded positively to measures of communication, although the proportions were consistently lower than those for trust. Young people reported that it was almost always true/often true/sometimes true that:
- their friends asked about their problems (87%)
- their friends sensed when they were upset (86%)
- their friends encouraged them to talk (80%)
- they told their friends about problems (80%).
For all 4 measures of communication, proportions were higher among females than males. The difference ranged from 5.3 percentage points for ‘their friends sensed when they were upset’ to 8.3 percentage points for ‘friends ask me about my problems’.
Figure 1: Quality of peer attachment among young people aged 16–17, 2016
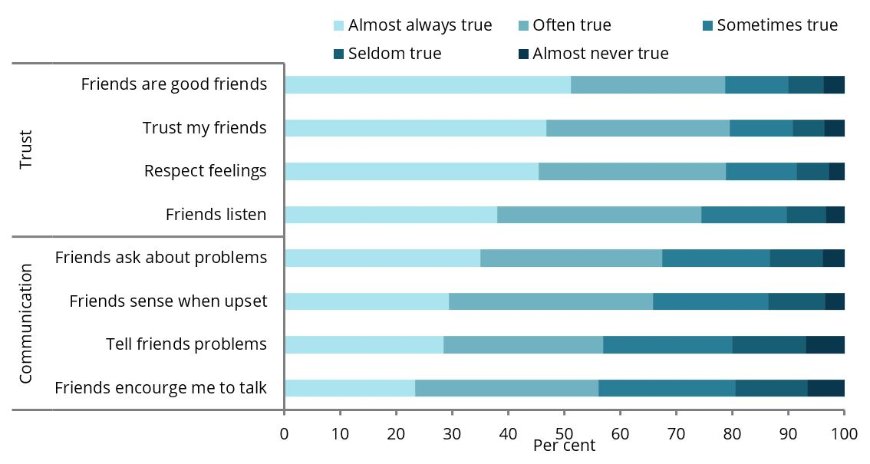
Chart: AIHW.
Source: AIHW analysis of the LSAC Wave 7.
Box 2: Measuring peer attachment
The LSAC wave 7 includes a peer attachment measure adapted from the Inventory of Peer and Parental Attachment. The scale included in the LSAC is made up of 2 sub‑scales: trust (4 items) and communication (4 items). Young people are asked to respond to the following statements:
- My friends sense when I’m upset about something.
- My friends encourage me to talk about my difficulties.
- My friends listen to what I say.
- I feel my friends are good friends.
- I trust my friends.
- My friends respect my feelings.
- I tell my friends about my problems and troubles.
- If my friends know something is bothering me, they ask me about it (Duffy et al. 2020).
In this section, individual items from the scale are reported based on young people’s response that the statement was always true/often true/sometimes true.
For more details, see Technical notes.
How do 16–17 year olds interact with friends?
The LSAC survey asked young people aged 16–17 how much time they spent interacting with friends face-to-face or electronically. In 2016:
- face-to-face interaction was the most common form of interaction (42% of young people interacted this way most of the time and 12% all or almost all of the time)
- more than a third (38%) interacted face-to-face and electronically in equal share
- just over 1 in 16 (5.9%) mostly interacted via electronic devices
- only 0.9% always or almost always interacted via electronic devices.
Box 3: Use of social media services
Social media services play an important role in keeping young people connected with family and friends.
According to the eSafety report, The digital lives of Aussie teens, in September 2020, young people aged 12–17 used an average of 4 different social media services. Those aged 12 to 13 used an average of 3.1 services compared with 4.5 for those aged 16 to 17.
The most popular social media services were:
- YouTube – 72%
- Instagram – 57%
- Facebook – 52%
- Snapchat – 45%
- TikTok (formerly known as Musical.ly) – 38%
- Discord – 19% (Office of the eSafety Commissioner 2021).
To whom do 16–17 year olds turn for help?
The LSAC asked young people aged 16–17 from whom they sought support in the last 12 months. In 2016:
- overall, most were likely to seek support from a friend (66%), followed by a parent (59%), brother or sister (33%), boyfriend/girlfriend (32%) or a teacher (22%)
- females reported higher levels of seeking help from each of the nominated categories, except for ‘other adults’ for which proportions were similar (Figure 2)
- 3.2% of young people reported that they did not seek help, even though they had emotional mental problems. The proportion of males (4.0%) who did not seek help was almost twice as high as for females (2.5%).
Figure 2: Selected sources of help for 16–17 year olds, 2016
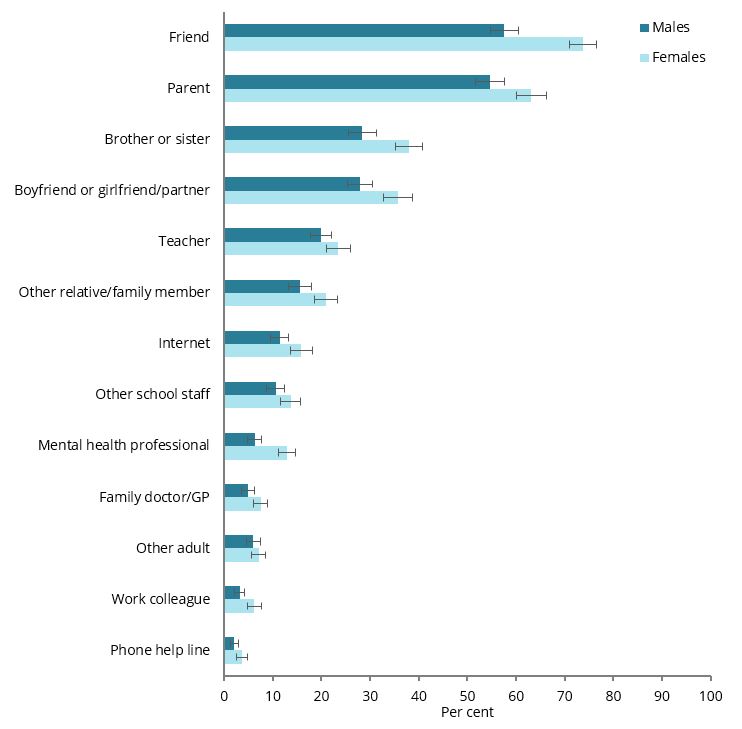
Chart: AIHW.
Source: AIHW analysis of the LSAC Wave 7.
To whom do young people (aged 18 and 24) turn in times of crisis?
In 2018, based on LSAY data for the cohorts Y15 (aged 18) and Y09 (aged 24), the vast majority (92% of the Y15 cohort and 94% of the Y09 cohort) reported that they could ask someone for any type of support in a time of crisis if they needed to.
Among the Y15 cohort, a slightly higher proportion of those living in non‑metropolitan areas could ask someone for support in a time of crisis than those living in metropolitan areas (95% and 91%, respectively). For the Y15 cohort, a higher proportion of those living in the highest socioeconomic areas could ask someone for support in a time of crisis than those living in the lowest socioeconomic areas (94% and 85%, respectively).
In relation to whom young people turned in a time of crisis:
- the most commonly reported person was the same for both cohorts: a family member, followed by a friend, and partner or boyfriend/ girlfriend (Figure 3). The proportion who turned to a family member was a little higher among the Y09 cohort than among the Y15 cohort (97% compared with 93%)
- a higher proportion of the Y09 cohort (aged 24) than the Y15 cohort (aged 18) turned to a partner or boyfriend/girlfriend (49% compared with 35%) and work colleagues (42% and 29%). The differences reflect social networks associated with older ages, such as the greater likelihood of having a partner or boyfriend/girlfriend and working full time
- a higher proportion of the Y15 cohort (aged 18) than the Y09 cohort (aged 24) turned to school/school counsellor (20% compared with 7.4%); a neighbour (17% compared with 11%); or a community, charity or religious organisation (17% compared with 12%).
Figure 3: To whom young people turn in time of crisis, by LSAY cohort Y09 and Y15, 2018
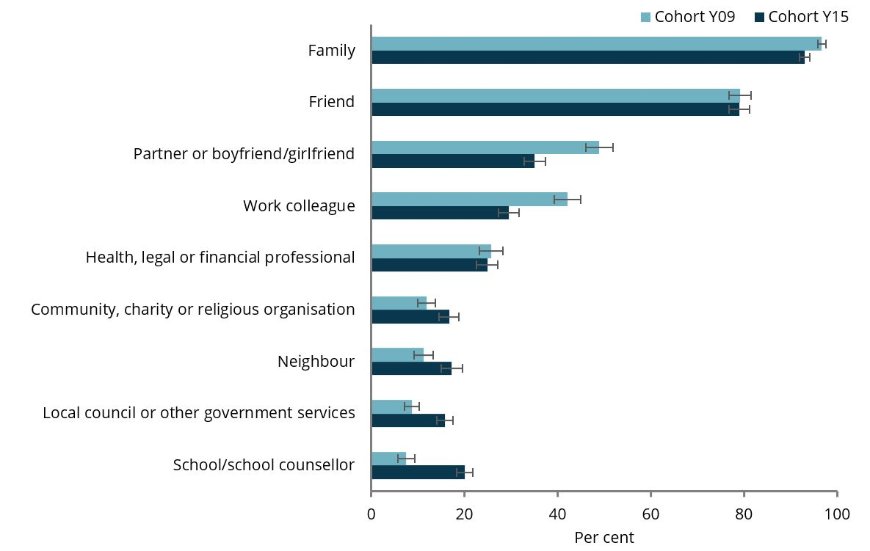
Chart: AIHW.
Source: AIHW analysis of the LSAY.
How often do young people (aged 15–24) get together?
Based on the HILDA, of young people aged 15–24 in 2018:
- the majority (92%) got together with friends/relatives not living with them either at least once a week (69%) or 1–3 times a month (23%)
- the proportion who got together at least once a week was higher among those living in Major cities than among those living in Inner regional areas (72% and 62%, respectively)
- the proportion who got together at least once a week was higher among those living in the highest socioeconomic area compared with the lowest (77% and 66%, respectively).
What types of social support do young people have?
The HILDA data set includes 10 questions relating to levels of social support. These data items are presented individually in this section.
In 2018, based on data from HILDA, among young people aged 15 to 24:
- around 9 in 10 (91%) (strongly) agreed that they enjoy the time they spend with the people who are important to them (Figure 4)
- around three-quarters or more (strongly) agreed that there is someone who can always cheer them up (77%); that when they need someone to help them out, they can usually find someone (78%); and that, when something’s on their mind, just talking with the people they know can make them feel better (75%)
- over half (strongly) agreed that they seem to have a lot of friends (58%). This was more common among males (64%) than females (52%), and among 15–19 year olds (64%) than among 20–24 year olds (53%).
However, in relation to negative constructs:
- around 1 in 4 (strongly) agreed that people do not come to visit them as often as they would like (26%). This was more common among 20–24 year olds (30%) than among 15–19 year olds (22%)
- 1 in 5 (strongly) agreed that they often felt very lonely (21%)
- over 1 in 10 (strongly) agreed that they do not have anyone to confide in (12%), and 8.9% (strongly) agreed that they have no one to lean on in times of trouble.
Figure 4: Types of social support among young people (aged 15–24), 2018
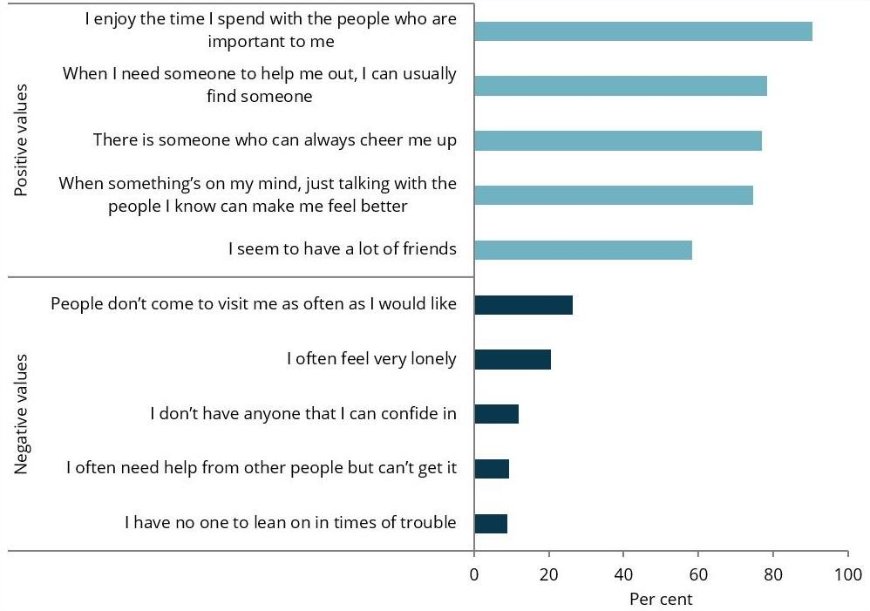
Chart: AIHW.
Source: AIHW analysis of the HILDA.
How many young people (aged 15–24) have low social capital?
The social support items included in the HILDA can be used to construct a social capital score (see Box 4).
Based on the social support data items in HILDA, in 2018, among young people aged 15–24, fewer than 1 in 10 (9.1%) had low social capital. The proportion of young people with low social capital was more than 3 times as high in the lowest socioeconomic areas (16%) than in the highest (4.3%). However, it should be noted that the proportion for the highest socioeconomic areas had a relative standard error of 28%, and so should be treated with caution (see Technical notes).
Box 4: Measuring low social capital
Social capital generally measures social networks, including intimate attachments to spouse and family, friendship and social support networks and acquaintances (including neighbours). The measure of social capital used in the HILDA’s survey is based on responses to a 10–item self-completion questionnaire administered in each wave.
The following statements are used to describe how much support participants get from other people. Response options range from 1 (strongly disagree) to 7 (strongly agree). An overall measure of social capital can be constructed which can range from a low of 1 to a high of 7. An individual is classified as having low social capital if their score is less than 4 (Wilkins & Lass 2018).
Items include:
- People don’t come to visit me as often as I would like
- I often need help from other people but can’t get it
- I seem to have a lot of friends
- I don’t have anyone that I can confide in
- I have no one to lean on in times of trouble
- There is someone who can always cheer me up
- I often feel very lonely
- I enjoy the time I spend with the people who are important to me
- When something’s on my mind, just talking with the people I know can make me feel better
- When I need someone to help me out, I can usually find someone (Wilkins & Lass 2018).
International comparisons
For school-age children, school is an important place for making friends. Being able to make friends easily at school affects how socially connected young people feel to school and is a part of school belonging (OECD 2019) (see also Secondary school education).
In 2018, based on international PISA results, among 15 year old Australian students, around 3 in 4 (76%) agreed or strongly agreed with the statement ‘I make friends easily at school’. This result was similar to the OECD average (75%) (Figure 1).
Figure 5: Making friends easily at school (15 year olds), by selected OECD countries, 2018
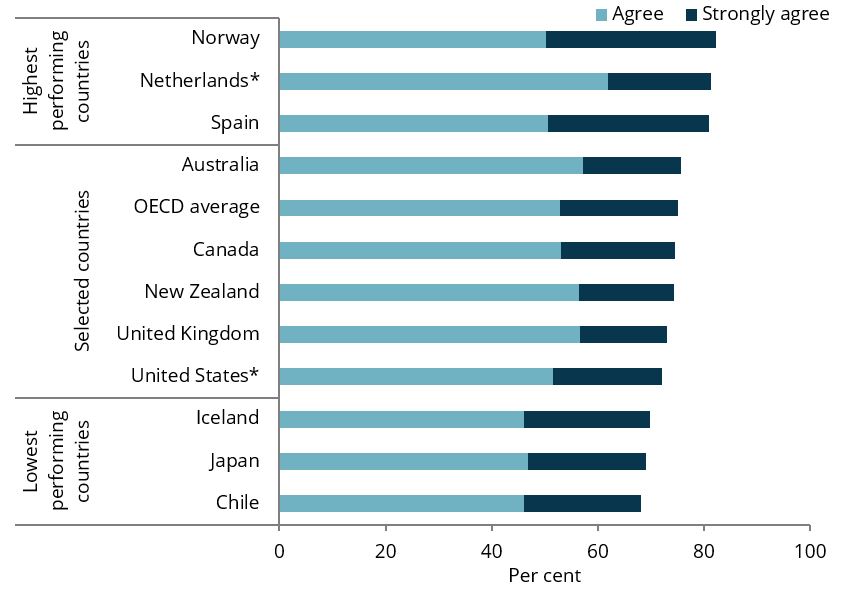
*Data did not meet the PISA technical standards but were accepted as largely comparable.
Chart: AIHW.
Source: OECD 2019.
Where do I find more information?
For information on topics related to negative peer relationships in Australia’s youth, see:
For information on Indigenous young people and contact with family, see:
- Section 3.5, Social support of Aboriginal and Torres Strait Islander adolescent and youth health and wellbeing 2018.
For information on children and social networks, see:
- Social networks in Australia’s children.