Australia's youth:
Unintentional injuries
Web article
Last updated:
Topic: Children & youth
Part of Australia's youth
Citation
AIHW (Australian Institute of Health and Welfare) (2021) Unintentional injuries, AIHW, Australian Government, accessed 7 July 2026.
Key findings
- In 2017–2019, among 15–24 year olds, unintentional injuries contributed to almost 1 in 3 (32%) deaths and more than 2 in 5 (43%) injury deaths.
- In 2019, unintentional injury deaths contributed to 399 deaths; the most common causes were land transport accidents (60%), accidental poisoning (20%) and accidental drowning (8.0%).
- Between 2007 and 2019, unintentional injury deaths decreased (from 18 to 12 deaths per 100,000 young people) while, between 2007–08 and 2016–17, hospitalised cases for unintentional injury remained stable (1,788 and 1,740 per 100,000, respectively).
- In 2018–19, sports injuries accounted for 31% of all unintentional injury hospitalised cases (17,600 cases).
- Unintentional injury deaths and hospitalised cases were higher for males than females.
Injuries are the leading cause of death among young people (see Deaths) and a major cause of hospitalisation (AIHW: Pointer 2019).
Adolescence and young adulthood is a time when independence increases and legal adulthood begins. Greater independence brings the potential for more risky behaviour, which can lead to injury. Serious injury can have long-lasting effects on young people’s health and wellbeing, including on their social and emotional development and occupational roles (NPHP 2004). Most injuries can be prevented by identifying and removing the cause or reducing exposure to them (DoH 2018). In recognition of the impact of injury on all Australians, a new National Injury Prevention Strategy 2021–2030 is being developed to reduce injury (DoH 2020).
Injuries can be intentional (such as self-harm or assault) or unintentional. This section focuses on unintentional injury, presenting data on deaths and those injuries that result in hospital admissions. Injuries treated in other settings (including emergency departments, hospital outpatient clinics, general practice and allied health practices) are not included.
For information on intentional injuries, see Mental illness for self-harm and Crime and violence for assault.
Box 1: Data sources on unintentional injuries
Deaths data are sourced from the AIHW National Mortality Database (NMD). The database comprises information about causes of death and other characteristics of the person, such as sex, age at death, area of usual residence and Indigenous status. These data are collected in Australia by the Registrars of Births, Deaths and Marriages in each state and territory. The data are then compiled nationally by the Australian Bureau of Statistics (ABS) and supplemented with information from the National Coroners Information Service. The ABS codes the data according to the International Classification of Diseases and provides them for the AIHW NMD. For more information on injury deaths, including how they are defined, as well as adjustments for Victorian additional death registrations in 2019, see Technical notes.
Data on hospitalised injury cases are sourced from the AIHW National Hospital Morbidity Database (NHMD). The NHMD is a collection of episode-level records from data collection systems for admitted patient morbidity in Australian hospitals. It includes records for all episodes of admitted patient care from essentially all public and private hospitals in Australia.
Note that injury cases reported here do not include presentations to emergency departments. Data presented in this section will underestimate injuries requiring hospital treatment.
How many young people die from unintentional injuries?
In the 3-years from 2017–2019, among young people aged 15–24:
- injuries (intentional and unintentional) contributed to almost three-quarters of all deaths (73%) (see also Deaths)
- unintentional injury deaths comprised around 1 in 3 (32%) of all deaths and 2 in 5 (43%) injury deaths.
In 2019, among young people aged 15–24:
- unintentional injury deaths contributed to 399 deaths – a rate of 12 per 100,000 young people
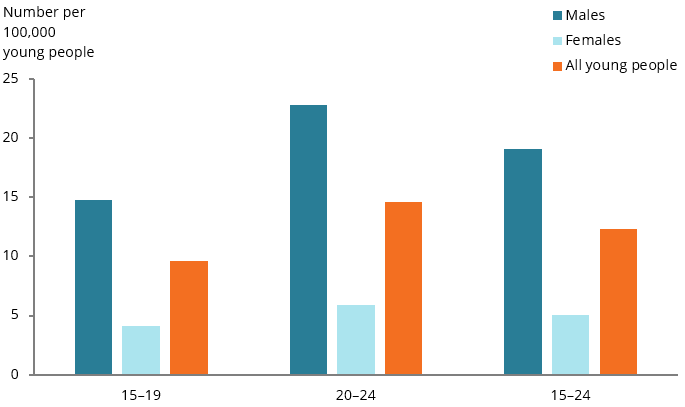
- the rate of unintentional injury deaths for young males (19 per 100,000) was 3.8 times as high as that for young females (5.1 per 100,000 females). This pattern was consistent among those aged 15–19 and 20–24. However, the difference was greater among the older age group. The rate for males was:
- 3.9 times as high as the rate for females among those aged 20–24 (23 per 100,000 males compared with 5.9 per 100,000 females) (Figure 1)
- 3.6 times as high as the rate for females among those aged 15–19 (15 per 100,000 males and 4.1 per 100,000 females).
Figure 1: Unintentional injury deaths among young people aged 15–24, by age and sex, 2019
Note: These data have been adjusted for Victorian additional death registrations in 2019. See Technical notes for more details.
Chart: AIHW.
Source: AIHW NMD.
What are the leading causes of unintentional injury death?
In 2019, among young people aged 15–24, the 3 leading causes of unintentional injury death – accounting for 88% of unintentional injuries – were:
- land transport accidents – 60% of unintentional injury deaths, or a rate of 7.4 per 100,000 young people (see also Box 2: How many young people die on Australian roads?)
- accidental poisoning and exposure to noxious substances (pharmaceuticals) – 20% or 2.5 per 100,000
- accidental drowning – 8.0% or 1.0 per 100,000.
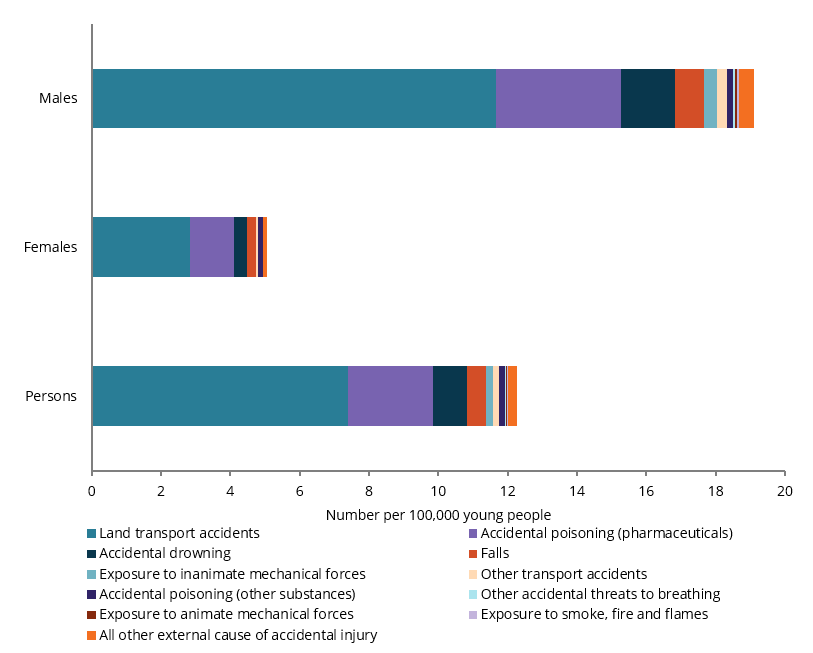
The 3 leading causes of unintentional injury deaths were the same for both sexes, with rates consistently higher for males, with:
- rates for land transport accidents just over 4 times as high for males as females (11.7 and 2.8 per 100,000, respectively) (Figure 2)
- rates for accidental poisoning by, and exposure to, noxious substances (pharmaceuticals) 2.8 times as high for males as females (3.6 and 1.3 per 100,000, respectively)
- accidental drownings were just over 4 times as high for males as females (26 compared with 6 for females, or rates of 1.6 and 0.4 per 100,000, respectively).
Figure 2: Leading causes of unintentional injury deaths among young people aged 15–24, by sex, 2019
Note: These data have been adjusted for Victorian additional death registrations in 2019. See Technical notes for more details.
Chart: AIHW.
Source: AIHW NMD.
Box 2: How many young people died on Australian roads?
In 2019, among young people aged 15–24:
- there were 225 on-road motor vehicle injury deaths, accounting for 1 in 5 (20%) of all unintentional on-road motor vehicle injury deaths
- on-road motor vehicle injury deaths made up 94% of all land transport accidents
- those aged 20–24 made up the highest proportion of any 5-year age group (12%); those aged 15–19 accounted for 7.8% of deaths
- the death rate among young males was 4 times as high as that for females (11 and 2.7 per 100,000, respectively).
- death rates increased with remoteness; compared with Major cities (4.3 per 100,000), rates were 2.5 times as high in Inner regional areas (11 per 100,000), 4.1 times as high in Outer regional areas (18 per 100,000) and 3.6 times as high in Remote and very remote areas (16 per 100,000)
- death rates in the lowest socioeconomic areas were 6 times as high as in the highest areas (12 compared with 1.9 deaths per 100,000, respectively).
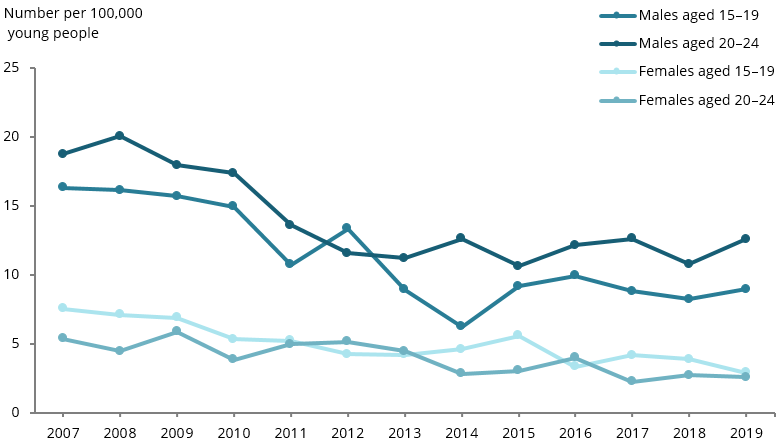
Between 2007 and 2019, among young people aged 15–24:
- the rate for motor vehicle injury deaths fell by around 43% from 12 to 6.9 deaths per 100,000
- rates decreased for both sexes across both age groups. Comparing the 2007 and 2019 rates, the large rate difference was for females aged 15–19 (by 62% or from 7.5 to 2.9 deaths per 100,000) followed by females aged 20–24 (by 52%, or from 5.4 to 2.6 deaths per 100,000) (see Figure 3).
Figure 3: On-road motor vehicle injury deaths, among young people aged 15–24, by age and sex, 2007 to 2019
Note: These data have been adjusted for Victorian additional death registrations in 2019 (see Technical notes for more details).
Chart: AIHW.
Source: AIHW NMD.
Have unintentional injury deaths changed over time?
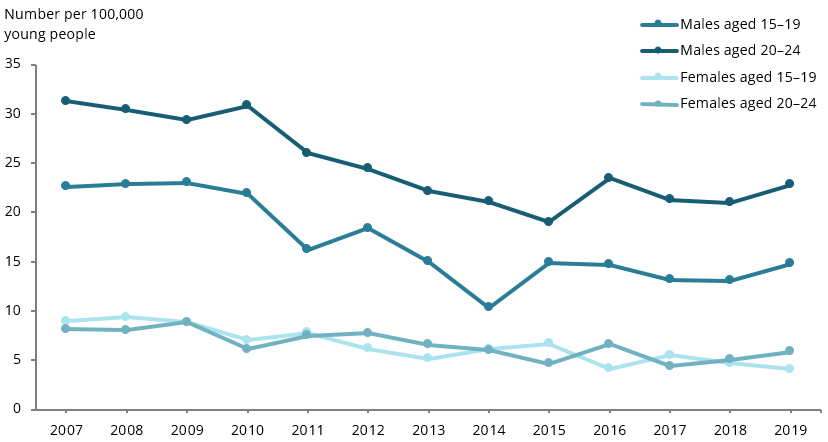
Between 2007 and 2019, among young people aged 15–24:
- unintentional injury death rates fell from 18 to 12 deaths per 100,000 young people
- the rates for both males and females fell over time. Comparing the 2007 and 2019 rates, the large rate difference (54%) was for females aged 15–19 (from 9.0 to 4.1 per 100,000). The second largest decrease (35%) was for males aged 15–19 (from 23 to 15 per 100,000)
- the rate for males was consistently higher than that for females, although the rate ratio fluctuated – from 4 times as high in 2010 to 2.6 times as high in 2014) (Figure 4).
Figure 4: Unintentional injury deaths among young people aged 15–24 by age and sex, 2007 to 2019
Note: These data have been adjusted for Victorian additional death registrations in 2019. See Technical notes for more details.
Chart: AIHW.
Source: AIHW NMD.
How many hospitalised cases for unintentional injuries are there?
In 2018–19, injury and poisoning accounted for 14% of all hospitalisations (see Technical notes) for young people aged 15–24 (AIHW 2020).
- For males aged 15–24, injury and poisoning was the top reason for going to hospital, contributing to almost a quarter (23%) of their hospitalisations.
- For females aged 15–24, injury and poisoning contributed to 8.2% of their hospitalisations (AIHW 2020).
In 2018–19, among young people aged 15–24:
- there were 57,400 hospitalised injury cases (see Technical notes for unintentional injuries – a rate of 1,771 per 100,000 young people
- males were 2.3 times as likely to be hospitalised for unintentional injuries as females (2,443 and 1,062 per 100,000, respectively). This pattern was consistent for both 15–19 year olds and 20–24 year olds (Figure 5).
Figure 5: Hospitalised unintentional injury cases among young people aged 15–24, by age and sex, 2018–19
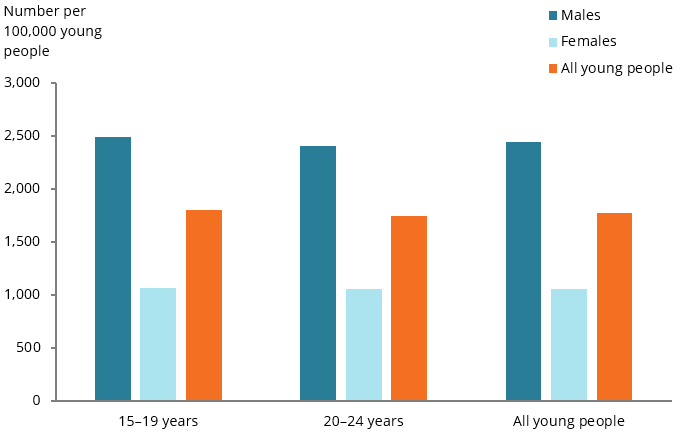
Chart: AIHW.
Source: AIHW NHMD.
What are the leading causes of hospitalised unintentional injury cases?
In 2018–19, among young people aged 15–24:
- land transport accidents were the most common reason for hospitalised unintentional injury cases (22% or around 390 cases per 100,000 young people).
- They were also the most common reason for hospitalised unintentional injury cases among females (25% or 267 per 100,000) (Figure 6)
- exposure to inanimate mechanical forces (for example, injuries from being struck with an object, see also Technical notes was the second most common reason for hospitalised unintentional injury cases for all young people (21% or around 379 cases per 100,000).
- This cause was, however, the most common accidental injury among males (24% or 579 per 100,000) and the third most common for females (16% or 167 per 100,000)
- falls (for example, falls due to collision with, or pushing by another person; falls due to roller-skates, skateboards, scooters; falls due to slipping or tripping), see also Technical notes, were the third most common reason for hospitalised unintentional injury cases for all young people (19% or around 341 cases per 100,000) and for males (19% or around 456 cases per 100,000).
- Falls were, however, the second most common reason for females (21% or around 220 cases per 100,000).
For information on sports injuries, see Box 3: How many hospitalised cases are for sports injuries?.
Figure 6: Hospitalised unintentional injury cases for young people aged 15–24, by leading specific causes of injury, by sex, 2018–19
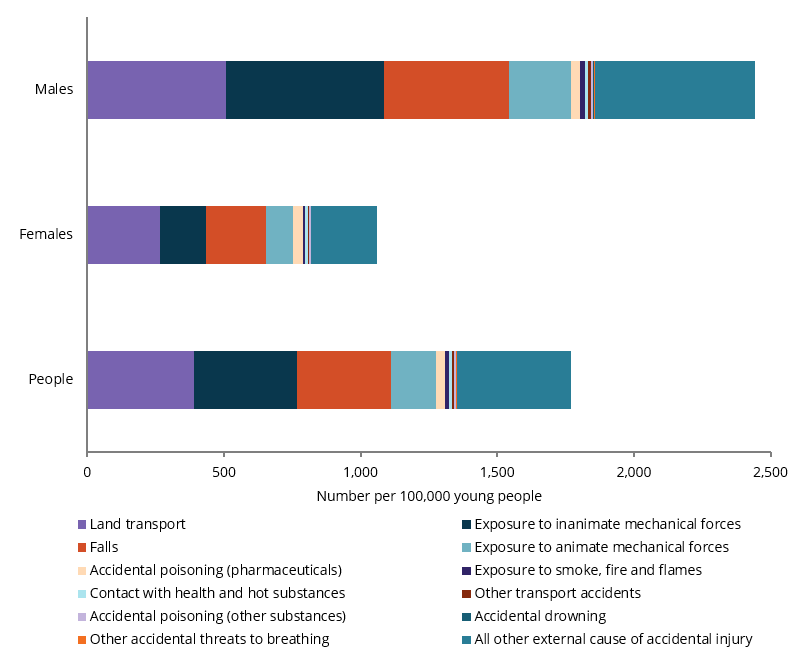
Chart: AIHW.
Source: AIHW NHMD.
Box 3: How many hospitalised cases are for sports injuries?
Sport plays a large part in the lives of many Australians; it has many health benefits (see Physical activity) and provides opportunities for social interaction (ABS 2011). However, playing sport is not without risk, and some sporting injuries can have long-term impacts.
In 2018–19, among young people aged 15–24:
- sports injuries accounted for 17,600 hospitalised cases, a rate of 543 per 100,000 young people. Sports injuries accounted for 31% of all unintentional hospitalised cases for this age group
- the sports injury rate was the highest of that for all age groups, and over twice that for children aged 0–14 (247 per 100,000) and 25–44 year olds (263 per 100,000)
- the rate for males was almost 3 times as high as that for females (801 per 100,000 and 271 per 100,000, respectively). This was true for both 15–19 year olds (3 times as high) and 20–24 year olds (2.9 times as high)
- the rate for 15–19 year old males was 1.6 times as high as the rate for males aged 20–24 (990 and 639 per 100,000)
- just over half of all hospitalised cases for sports injury were for football codes (51%). Injury from playing football codes was also the most common hospitalised sports injury for both males and females (55% and 37%, respectively) and for both 15–19 year olds and 20–24 year olds (53% and 47%, respectively)
- motorcycling (6.3%), basketball (5.5%), cycling (5.4%) and skateboarding (3.6%) had the next highest proportions of injury hospitalised cases for all young people
- for males, motorcycling (7.7%) was the second most common hospitalised sports injury, while cycling was the third (6.3%)
- for females, netball (13%) and trail or general horseback riding (9.8%) were the second and third most common hospitalised sports injuries.
Between 2007–08 and 2016–17, hospitalised cases for sports injury increased from 446 to 534 per 100,000 young people. Cases increased for both males (from 742 to 812 per 100,000) and females (from 134 to 243 per 100,000), and for both 15–19 year olds (from 549 to 662 per 100,000) and 20–24 year olds (from 348 to 423 per 100,000).
The largest rate differences between 2007–08 and 2016–17 were for females: an increase of 81% for 15–19 year olds (from 164 to 298 per 100,000), and 85% for 20–24 year olds (from 106 to 196 per 100,000) (Figure 7).
For more information on sports injuries relating to the whole of population, see Hospitalised sports injury in Australia, 2016–17.
Figure 7: Hospitalised cases for sports injury, young people aged 15–24, by age and sex, 2007–08 to 2016–17
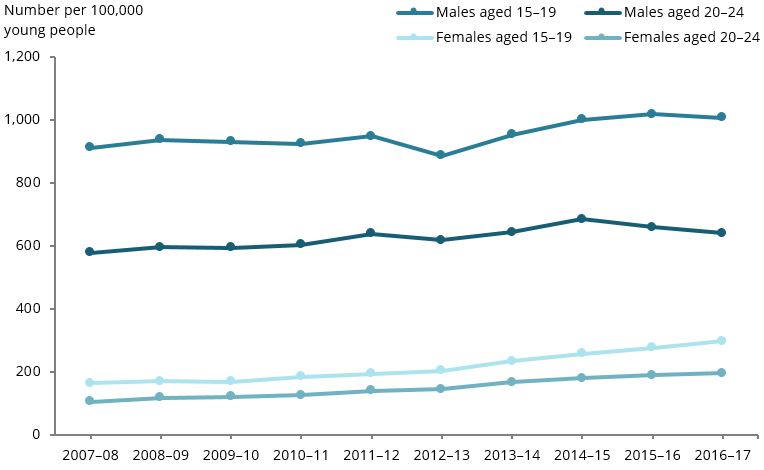
Chart: AIHW.
Source: AIHW NHMD.
Hospitalisation rates are considerably higher when viewed as a proportion of the number of people who report playing sport, rather than as a proportion of the general population as a whole (see AIHW: Kreisfeld & Harrison 2020 for more details).
Across all sports and all age groups, 10% of people admitted to hospital due to a sports injury had life-threatening injuries. The sports with the highest proportions of life‑threatening cases were swimming and diving (27%), cycling (24%), equestrian activities (24%), wheeled motor sports (21%) and recreational walking (19%). Recreational walkers tend to be older than participants in most other sports. More than half of walkers hospitalised in 2016–17 were aged 65 or over (AIHW Kreisfeld & Harrison 2020).
Have hospitalised unintentional injury cases changed over time?
Due to a break in series in 2017–18, time-series analysis is presented only for 2007–08 to 2016–17 (see Technical notes for more details).
Between 2007–08 and 2016–17, among young people aged 15–24, the rate:
- of hospitalised unintentional injury cases remained stable (1,788 and 1,740 per 100,000, respectively). It reached its highest point in 2011–12 (1,806 per 100,000)
- for males was consistently higher than that for females. However, there was a decrease in the overall rate for males (from 2,703 to 2,455 per 100,000) and an increase for females (from 826 to 992 per 100,000).
In comparing the 2007–08 and 2016–17 rates, the largest rate decrease (12%) was for males aged 15–19 (from 2,826 to 2,484 per 100,000), while the largest rise (27%) was for females aged 20–24 (from 782 to 994 per 100,000) (Figure 8).
Figure 8: Hospitalised unintentional injury cases among young people aged 15–24, by age and sex, 2008–09 to 2016–17
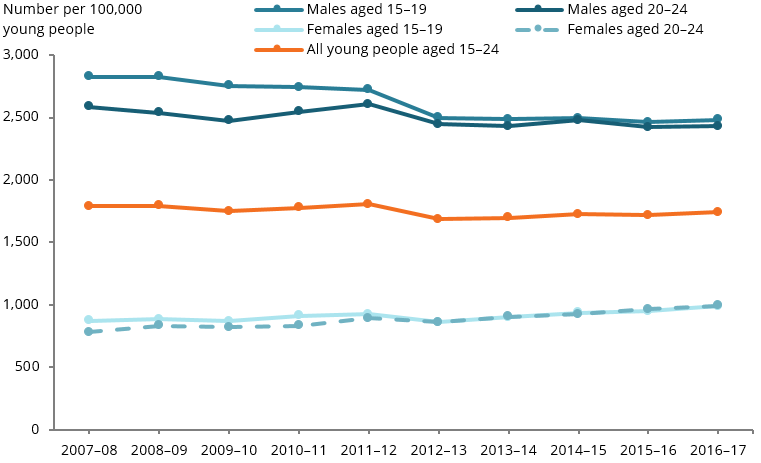
Chart: AIHW.
Source: AIHW NHMD.
Are unintentional injury rates the same for everyone?
Injury deaths
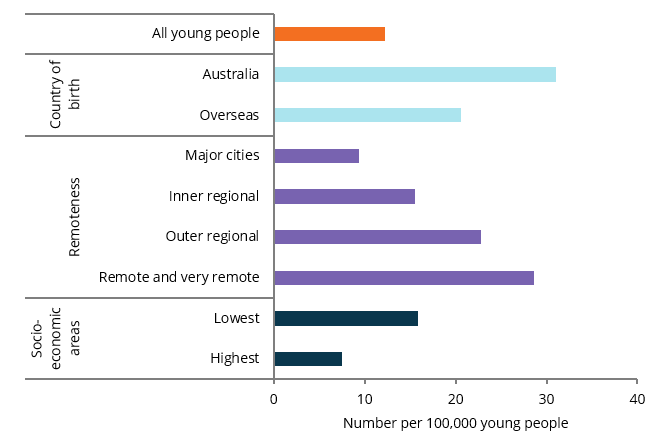
In 2019, among young people aged 15–24, the unintentional injury death rate:
- was 1.5 times higher among Australian-born young people than among those born overseas (31 compared with 21 per 100,000)
- increased with remoteness. Compared with Major cities (9.3 per 100,000), it was 1.7 times as high in Inner regional areas (16 per 100,000), increasing to over 3 times as high for Remote and very remote areas (29 per 100,000) (Figure 9)
- was more than twice as high among those living in the lowest socioeconomic areas compared with the highest socioeconomic areas (16 per 100,000 compared with 7.5 per 100,000, respectively).
Figure 9: Unintentional injury deaths for young people aged 15–24, by population groups, 2019
Note: These data have been adjusted for Victorian additional death registrations in 2019. See Technical notes for more details.
Chart: AIHW.
Source: AIHW NMHD.
Hospitalised unintentional injury cases
In 2018–19, among young people aged 15–24, the rate of unintentional hospitalised injury cases was:
- more than twice as high for those living in Remote areas (3,564 per 100,000) and Very remote areas (3,496 per 100,000) compared with Major cities (1,530 per 100,000) (Figure 10).
In 2016–17, the rate was:
- 1.2 times as high for young people living in the lowest socioeconomic areas as for those in the highest areas (1,836 and 1,476 per 100,000, respectively) (see also Technical notes).
Figure 10: Hospitalised unintentional injury cases for young people aged 15–24, by remoteness areas, 2018–19
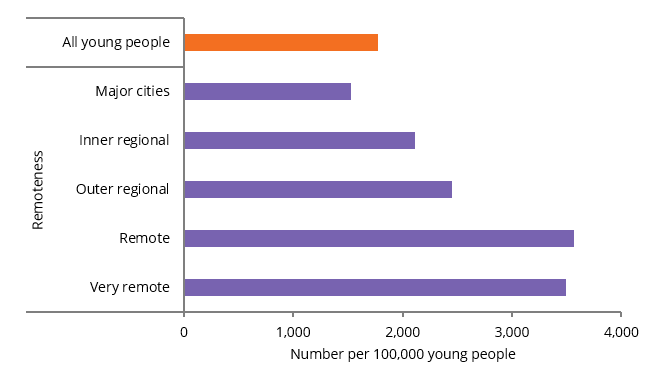
Chart: AIHW.
Source: AIHW NHMD.
Where do I find more information?
For information on topics related to injuries in this report, see:
- Crime and violence for assault
- Mental illness for self-harm.
For information on Indigenous young people and injuries, see:
- Section 7.1, Prevalence of health conditions and injury of Aboriginal and Torres Strait Islander adolescent and youth health and wellbeing 2018
- Measure 1.03, Injury & poisoning in Aboriginal and Torres Strait Islander Health Performance Framework (HPF) report 2020.
For information on:
- injury deaths and hospitalised cases for children aged 0–14, see Australia’s children
- injury deaths for children aged 0–14 disaggregated by states and territories, see ‘Injury deaths’ in Children’s Headline Indicators
- all hospitalised injuries for young people, see: Hospitalised injury in children and young people 2017–18.
- whole-of-population injury hospitalisations and deaths (including disaggregation for young people aged 15–24), see: Injury in Australia, 2017–18
- land transport crashes, see: Hospitalised injury due to land transport crashes
- eye injuries, see: Eye injuries in Australia, 2010–11 to 2014–15
- road deaths, see: the Bureau of Infrastructure and Transport Research Economics (BITRE) Road safety statistics
- sports injuries, see Hospitalised sports injury in Australia, 2016–17.